November 19, 2021 4:08 PM

China has agreed to release oil from its National Food and Strategic Reserves Administration. The amount and timing have yet to be decided, however in September they sold 7.4 million barrels of crude. In addition, they released gasoline and diesel earlier this month.
US President Joe Biden first asked OPEC to increase supply output. They said no. Then he turned to other oil importing countries, such as China, India and Japan, and asked them to release supply. Whether China’s sale of oil was the result of Joe Biden’s conversation with President Xi or not, we may never know. Traders are now looking for the US to release its own oil from the SPR. Otherwise, Joe Biden would look silly.
What factors move the price of oil?
BUT with Covid fears creeping back into the markets, it may be possible for oil to continue its move lower. The lower move based on SPR releases may now be turning into a continued move lower based on fears of lack of demand for oil, as Austria has gone under lockdown. Germany is also considering stringent measures and has not ruled out lockdowns!
WTI Crude Oil had been moving higher in a channel formation since the lows in April 2020 and reached a near term high on October 25th, at 85.90. Price briefly spiked through horizontal resistance at 85.50 from 2014 and pulled back. Not only was this horizontal resistance, but it was also just below the 161.8% Fibonacci extension from the his of July 5th to the lows of August 23rd. Crude then began pulling back. On Thursday, WTI held prior resistance (now horizontal support) at 77.15 and the bottom trendline of the upward sloping channel near that same level. However, today WTI has traded below 77.15. A close below yesterday’s close at 79.05 would be a bearish engulfing candle, suggesting more downside to come.
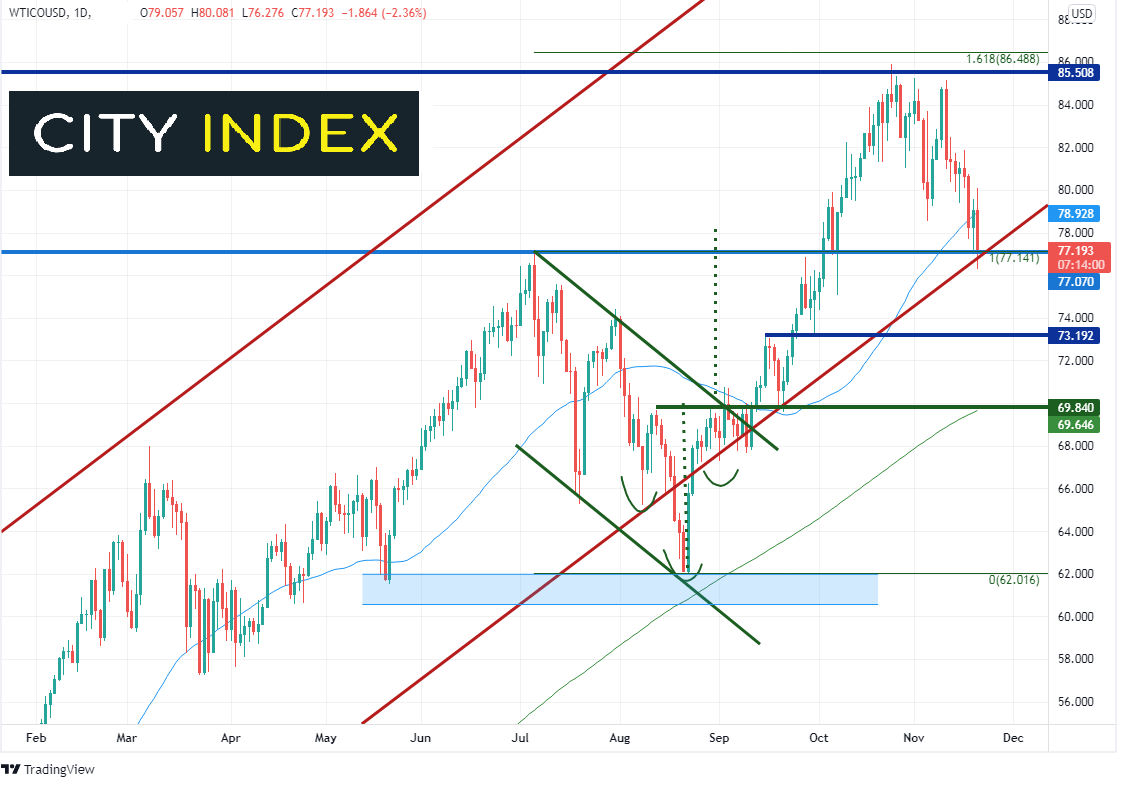
Source: Tradingview, Stone X
On a 240-minute timeframe, WTI oil is desperately trying to hold above the 38.2% Fibonacci retracement from the lows of August 22nd to the highs of October 25th, near 76.77. If the bearish engulfing candle on the daily timeframe plays out, below the 38.2% Fibonacci retracement level is horizontal support at 75.06, then the 50% retracement level from the same timeframe near 73.95. Resistance is back at todays highs (also horizontal resistance at 80.08, then resistance from the highs of November 16th at 81.87.
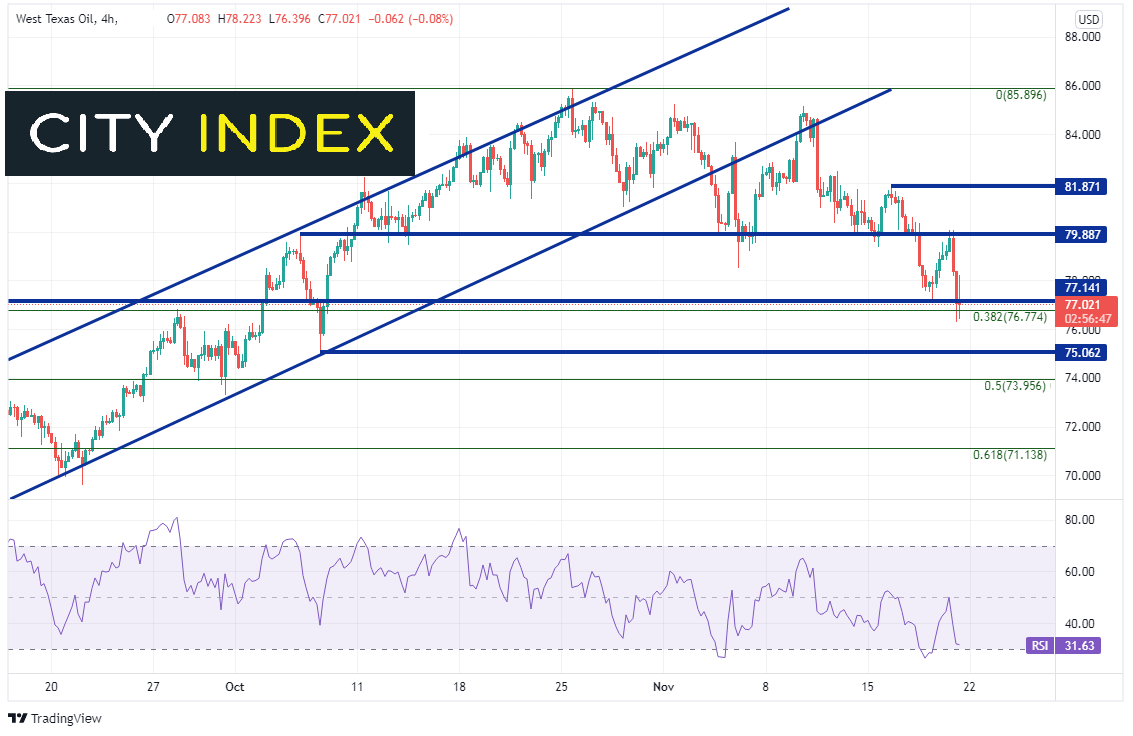
Source: Tradingview, Stone X
t!
Trade USD/CAD now: Login or Open a new account!
• Open an account in the UK
• Open an account in Australia
• Open an account in Singapore
USD/CAD is highly negatively correlated with USD/CAD. The current correlation coefficient on a daily timeframe is -0.83. Readings under -0.80 or over +80.0 are considered strong correlations. Therefore, if WTI continues to move lower, one can expect USD/CAD to move higher. The pair recently broke through the 61.8% Fibonacci retracement from the highs of September 29th to the lows of October 21st, at 1.2589, and is on its way to the target of an AB=CD pattern near 1.2715. Also notice that on October 21st, USD/CAD broke out of a descending wedge. The target is a 100% retracement of the wedge, or 1.2775. Support is at 1.2588 and then horizontal support at 1.2493.
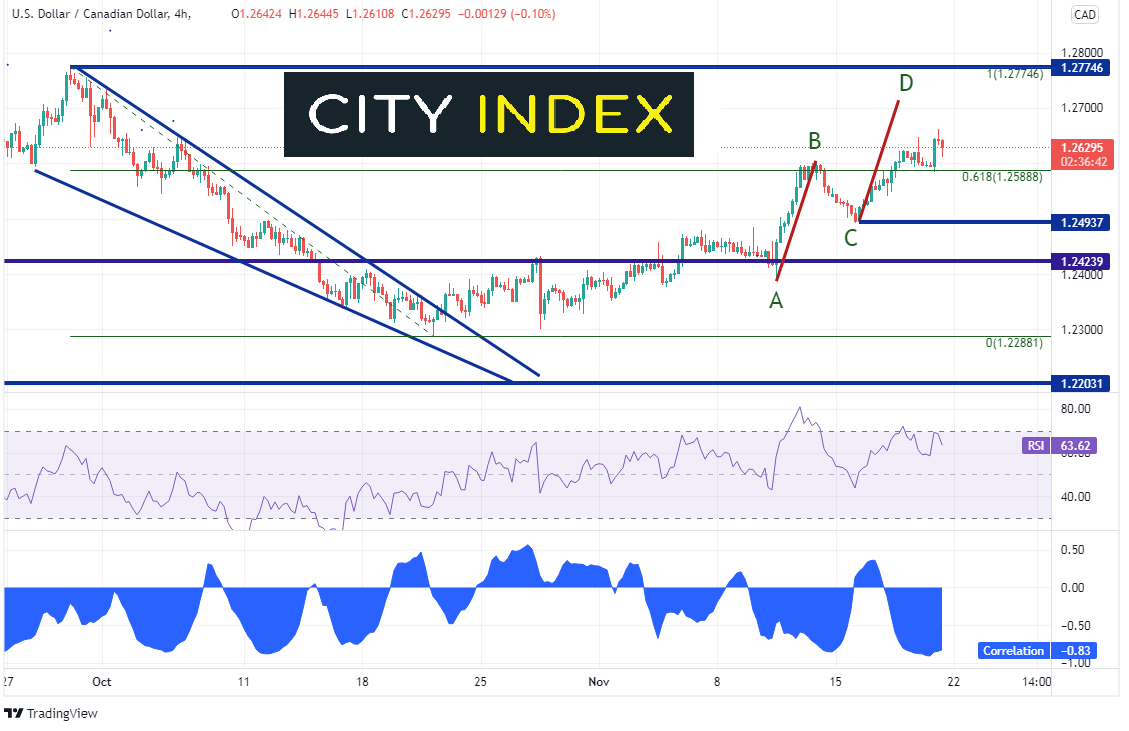
Source: Tradingview, Stone X
Is the oil selloff from the release of supply from the SPRs over yet? It might be, but now there are new fears creeping into the markets: that a 4th wave of the coronavirus may be hitting parts of Europe.
Learn more about forex trading opportunities.
Latest market news
Yesterday 01:32 PM
Yesterday 09:35 AM
Yesterday 07:23 AM
Yesterday 04:48 AM
Yesterday 12:17 AM
July 25, 2024 10:39 PM
Latest USD/CAD articles

May 3, 2024 07:01 AM

April 16, 2024 04:24 AM

November 21, 2023 12:00 PM

November 10, 2023 04:00 PM