
Pattern Play: LKQ Corporation
LKQ Corporation (LKQ), a leading global distributor of non-OEM (not the Original Equipment Manufacturer) automotive parts, broke out to the upside of a short-term bullish pennant on Tuesday, November 24th. The RSI is above its neutrality area of 50. The simple moving averages (SMA) are set-up in a bullish manner, with the 20-day SMA above the 50-day SMA and the 50-day SMA above the 200-day SMA. Price will likely consolidate above the upper trendline of the pattern before advancing towards the 2020 high of about 38.50. If price can breakout above 38.50, then price should advance towards 41.25, a level last reached in early 2018. On the other hand, if price falls below the upper trendline of the pattern, then traders should look to 33.25 for a bounce. If price fails to rebound off of 33.25 it would be a bearish signal that could send price tumbling back to 29.50.
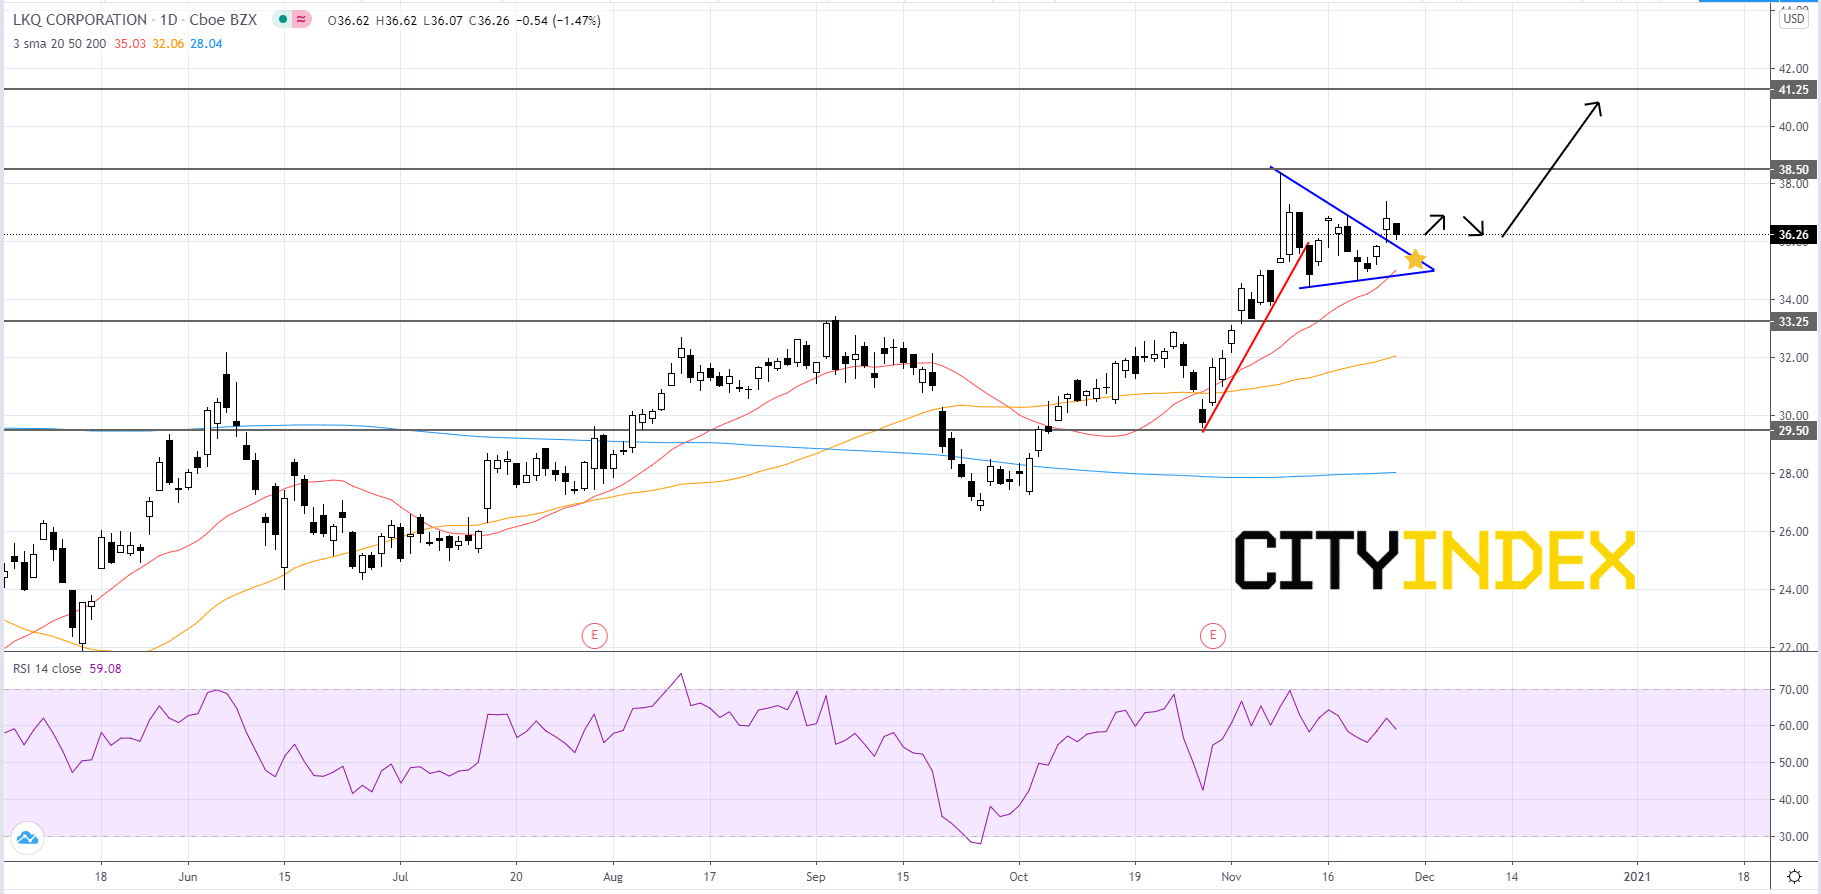
Source: GAIN Capital, TradingView
Source: GAIN Capital, TradingView
Latest market news
Today 12:54 AM
Yesterday 08:00 PM
May 4, 2024 08:00 PM
May 4, 2024 08:00 AM
Latest Stocks articles

May 2, 2024 04:00 PM

April 17, 2024 11:00 AM

March 21, 2024 04:05 AM

March 7, 2024 05:03 AM