

- Nasdaq 100 analysis: Stocks rebound as weak data undermine yields ahead of big tech earnings
- But risks remain as AI optimism fades and amid a hawkish Fed
- Nasdaq 100 technical analysis still paint a bullish picture
Nasdaq 100 analysis video and insights on Dow Jones and S&P
Shares on Wall Street opened higher today, after index futures regained some ground lost during Wednesday’s sell-off that was triggered by a hawkish FOMC. The mini turbulence in the markets has left investors grappling with some uncertainty, with the tech sector taking a notable hit after Powell spoke and disappointing tech results from the likes of Alphabet and AMD. There will be more earnings results to look forward to after the close of play, with Apple, Amazon and Meta all due to report their numbers. If results from the other tech giants are anything to go by, more disappointment could be on the way.
Nasdaq 100 analysis: Stocks rebound as weaker data weighs on yields
Despite Wednesday's setback, investor sentiment remained cautiously optimistic as US indices held onto their gains shortly after the open, with markets in Europe also firmer. While Fed Chair somewhat successfully attempted to recalibrate expectations for interest rate cuts, as he emphasised a cautious approach to policy easing, the bond markets have rallied nonetheless, causing yields to fall. This has been driven in part because of weakness in US labour market data we have seen over the past couple of days, with ADP private payrolls, jobless claims, Challenger Jobs cuts and the employment component of the ISM manufacturing PMI all missing expectations, increasing the risk that Friday’s US jobs report will also miss the mark.

Could 2024 be a bullish year for stocks?
Despite the recent downturn, proponents of a bullish outlook for 2024 point to the historical significance of January's performance as an indicator of the year's overall trajectory. The "January Barometer," a phenomenon observed since 1938, suggests that if stocks rise in January, the likelihood of a positive year-end outcome is high. According to data cited by Bloomberg from Stock Trader's Almanac, this barometer has been correct about 74% of the time.
But risks remain as AI optimism fades and amid a hawkish Fed
With investors now paring back their bets over a sooner rate cut from the Fed, and some shine coming off the AI-driven rally, some investors may now think twice about buying stocks at these elevated levels. So, there is a risk we could see a deeper pullback in the next few days, earnings permitting.
The concerns over the exuberance in AI-related stocks were further exacerbated by lacklustre performances from key players in the sector. Intel's gloomy forecast last week set a sombre tone, and this week witnessed Alphabet, AMD, and Microsoft experiencing declines in their shares following disappointing results and updates.
Nasdaq 100 technical analysis
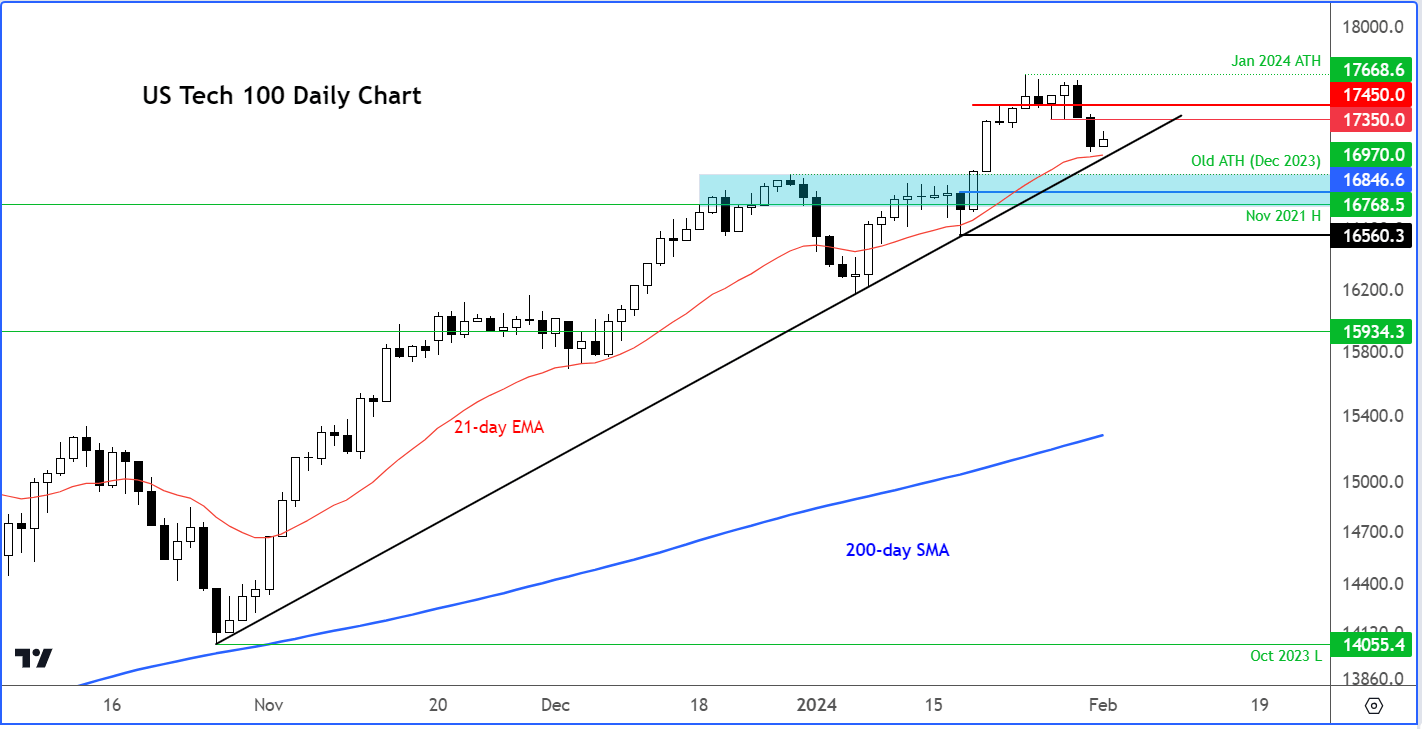
Source: TradingView.com
Turning to technical analysis, the Nasdaq has bounced after a two-day drop but remains to be seen where it will head from here. Just below Wednesday’s low represents the convergence of the bullish trend line since November and the 21-day exponential moving average. If the index gets there and break below it, then things could get interesting. The more significant support levels from previous all-time highs in December 2021 and November 2021 are marked by the shaded region on my chart.
The mid-week sell-off, while impactful, has not triggered a major technical breakdown in the bullish trend. But if now do see a breakdown below some of the levels mentioned above, then the bears might come out more forcefully.
On the upside, there are now identified areas of resistance such as 17350 that bearish traders will need to closely monitor.
In conclusion, the recent market fluctuations serve as a reminder of the inherent volatility in financial markets. While the Nasdaq suffered a setback, the overall trend remains technically bullish. Traders must exercise prudent risk management strategies, acknowledging that markets can experience downturns as well as upswings. As the dust settles, the question remains whether the dip-buyers will re-merge to steer the major indices to fresh record highs or if the recent drop marks the beginning of a more prolonged correction. I guess time will tell. Watch your levels closely.
-- Written by Fawad Razaqzada, Market Analyst
Follow Fawad on Twitter @Trader_F_R
How to trade with City Index
You can trade with City Index by following these four easy steps:
-
Open an account, or log in if you’re already a customer
• Open an account in the UK
• Open an account in Australia
• Open an account in Singapore
- Search for the company you want to trade in our award-winning platform
- Choose your position and size, and your stop and limit levels
- Place the trade
Latest market news
Yesterday 01:32 PM
Yesterday 09:35 AM
Yesterday 07:23 AM
Yesterday 04:48 AM
Yesterday 12:17 AM
July 25, 2024 10:39 PM
Latest Nasdaq articles

Yesterday 01:32 PM

July 25, 2024 01:17 PM

July 25, 2024 01:01 AM

July 23, 2024 01:38 PM