August 25, 2021 4:44 PM
Index in Focus: Russell 2000 making a strong move of its own!
While the S&P 500 and the NASDAQ 100 have been making all-time highs, the small cap Russell 2000 has been underperforming and is nearly 5% below its all-time highs. This is even after posting a 5.5% gain over the last 4 days. Why is RUT underperforming its stock index peers? Smaller companies are more sensitive to higher interest rates and higher inflation. With the expectation of tapering to begin “sooner than later”, companies in large cap indices are better positioned to produce strong earnings even though inflation is rising.
Click here to trade the Russell 2000!
The NASDAQ 100/Russell 2000 shows the ratio of the 2 assets. If the line is moving higher, then the NASDAQ 100 is performing better. If the ratio is decreasing, then the Russell 2000 is performing better. Below we can see that from early September 2020 until mid-March the ratio was moving lower, as investors were concerned that the economy would reopen and the “stay at home” NASDAQ 100 stocks would underperform the mom and pop Russell 2000 “go out” stocks, particularly in hospitality and leisure. In mid-March, when Fed Chairman Powell said that “substantial further progress” would be needed before the Fed would begin tapering, investors got nervous as inflation and inflation expectation were on the rise (not believing Powell, who said inflation will be “transitory”). Therefore, the NASDAQ 100 began to outperform the Russell 2000.
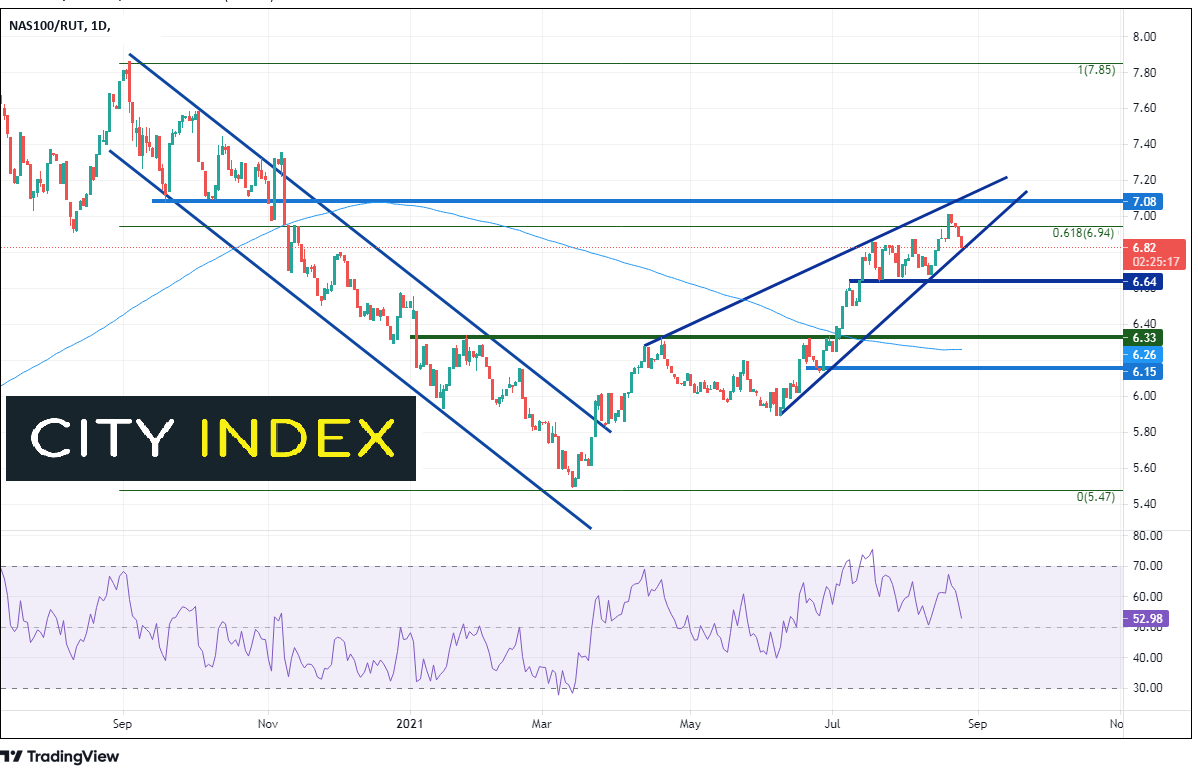
Source: Tradingview, Stone X
Since the reversal in March, the ratio has been forming an ascending wedge. Last week, the ratio moved above the 61.8% Fibonacci retracement from the September 2nd highs to the March 12th lows at 6.94. Horizontal resistance sits just above at 7.08. However, since then the ratio has turned lower and it is threatening to take out the bottom trendline of the ascending wedge, near 6.08. If the ratio moves below the trendline, it has room to move to the downside. First support is at 6.64, with room to move to 6.33.
The Russell 2000 was moving higher from late October 2020 until March. However, as the NASDAQ 100/Russell 2000 ratio began moving higher, the Russell 2000 was only moving sideways. The Russell 2000 broke below its upward trend and has been trading between 2085.12 and 2360.17 ever since! Last week, the small cap index traded below the 200 Day Moving Average at 2085.12 and failed, resulting it the previously mentioned 5.5% gain over the last 4 days However, near-term resistance is just above at 2256.44. If price breaks above there, it can move to test its own all-time highs at 2360.16. Support is below at the 200 Day Moving Average, then the lows from August 19th at 2122.24. Below there, price can fall to the bottom of the range near 2085.12.

Source: Tradingview, Stone X
The Russell 2000 has had strong gains over the last 4 days. This may very well be positioning ahead of Fed Chairman Powell’s speech on Friday at the Jackson Hole Symposium. With the NASDAQ 100/ Russell 2000 turning lower and threatening to break below the ascending wedge, the index may be at the start of a new trend!
Learn more about index trading opportunities.
Latest market news
Yesterday 01:32 PM
Yesterday 09:35 AM
Yesterday 07:23 AM
Yesterday 04:48 AM
Yesterday 12:17 AM
July 25, 2024 10:39 PM
Latest Indices articles

July 25, 2024 01:30 PM

July 25, 2024 01:01 AM

July 25, 2024 12:41 AM

July 24, 2024 07:26 PM