

Following a nearly -30% decline in the first half of the year, its worst start to a year ever, the NASDAQ 100 (US Tech 100) index has at least stabilized in the 11,000s this month. That fragile calm will be put to the test over the next couple of weeks as the heavily-weighted Big Tech stocks report earnings in the coming weeks (see my colleague Josh Warner’s full Big Tech earnings preview report).
Ahead of the fundamental data dump, it’s worthwhile to revisit the index’s outlook from a sentiment and technical perspective:
Nasdaq 100 traders are growing less bullish
According to our internal data, traders on our retail platforms (FOREX.com and City Index) are now less bullish on the Nasdaq 100 than they’ve been at any point since May, with “only” about 67% of open positions on the long side. Despite the ongoing bearish trend, this figure had risen as high as 88% long around the start of the month.
While it may “feel” good to be surrounded by people who agree with you, most experienced traders believe that the strongest signals from positioning data are contrarian; in other words, an extremely lopsided long position can signal a market that is more prone to falling (i.e. if “everyone” has already bought, then there is no one left to buy) whereas excessive bearish positioning could be a sign that the market may rally. In that light, our traders’ relatively pessimistic positioning in the Nasdaq 100 may be a signal that the index is poised for a potential counter-trend rally. That said, traders are still net long on balance, so its not necessary a sign of a long-term bottom.
Nasdaq 100 technical analysis
Meanwhile, from a technical perspective, Nasdaq 100 bulls have stopped the index’s downward slide over the last week. As the chart below shows, the index has put in a series of “higher lows” since testing 11,000 in mid-June, but prices have yet to break above the confluence of previous resistance and the 50-day EMA at 12,200:
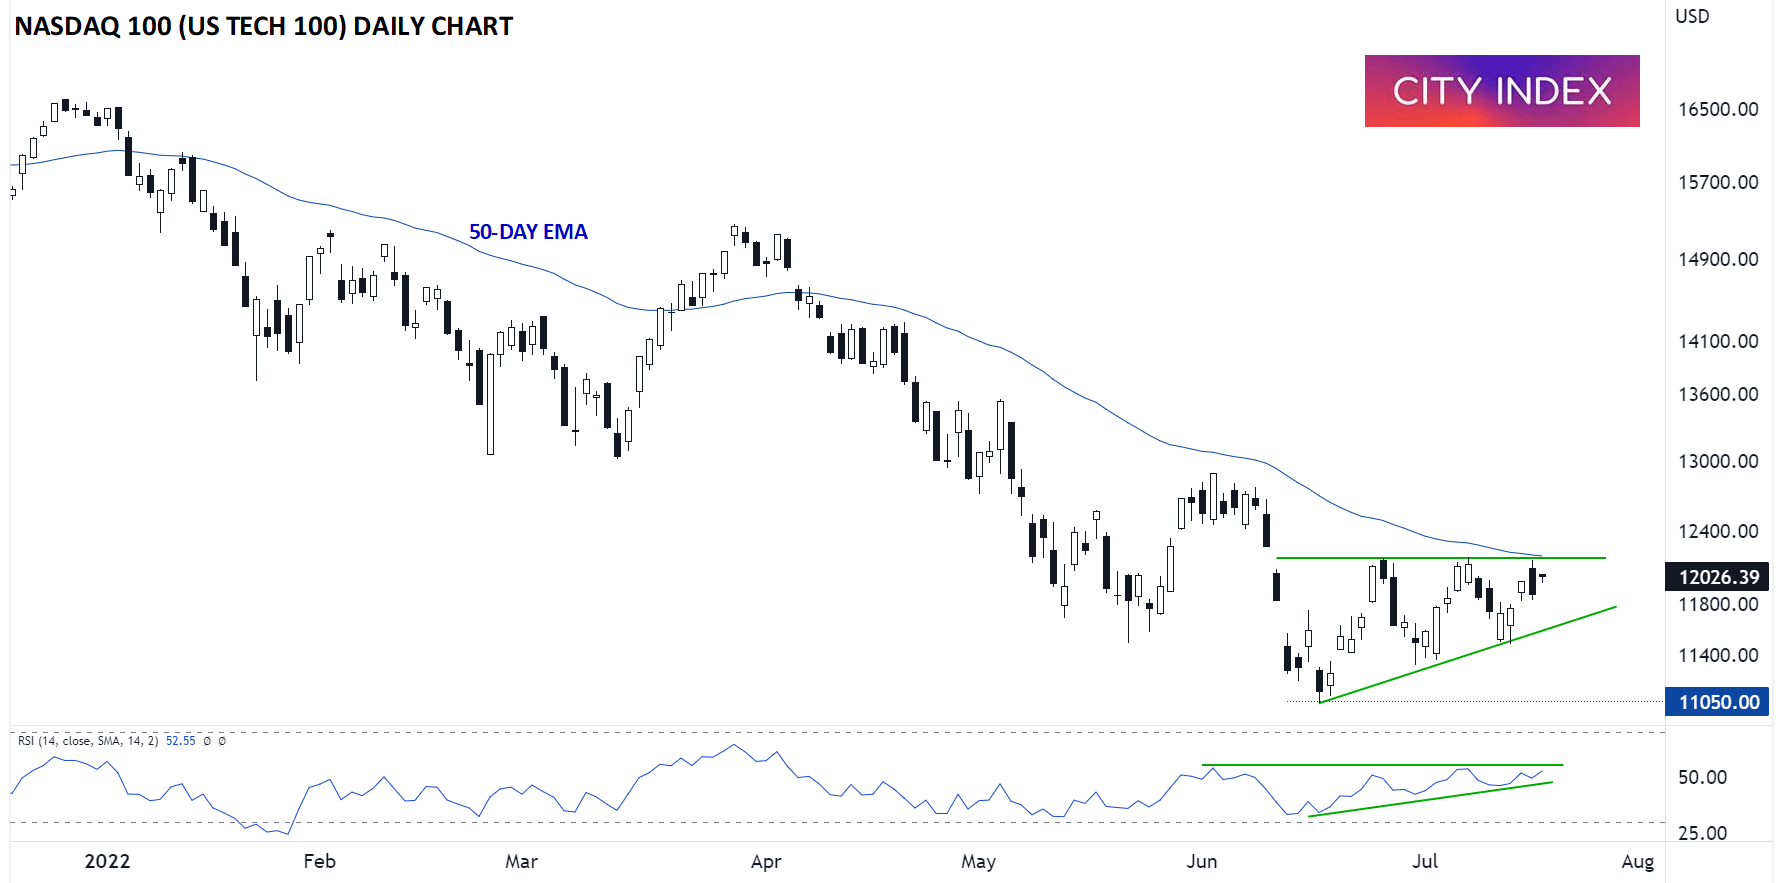
Source: StoneX, TradingView
Notably, the index’s RSI indicator is forming a similar pattern as price itself; astute traders will be monitoring the indicator for a breakout that could lead or confirm the breakout in price itself.
Ultimately, the Nasdaq 100’s near-term performance will hinge on how investors interpret the Big Tech earnings season, starting with Netflix’s highly-anticipated report this afternoon. That said, the balance of the positioning, technical, and fundamental forces still suggest the index is in a bear market, and traders are likely to fade any near-term rallies at least until prices can break durably above 13,000.
How to trade with City Index
You can trade with City Index by following these four easy steps:
-
Open an account, or log in if you’re already a customer
• Open an account in the UK
• Open an account in Australia
• Open an account in Singapore
- Search for the market you want to trade in our award-winning platform
- Choose your position and size, and your stop and limit levels
- Place the trade
Latest market news
Yesterday 01:32 PM
Yesterday 09:35 AM
Yesterday 07:23 AM
Yesterday 04:48 AM
Yesterday 12:17 AM
July 25, 2024 10:39 PM
Latest Indices articles

July 25, 2024 01:30 PM

July 25, 2024 01:01 AM

July 25, 2024 12:41 AM

July 24, 2024 07:26 PM