

Learn the key harmonic patterns to use in your technical analysis here, plus how to trade using harmonic chart patterns.
- What are harmonic patterns
- Do harmonic patterns work?
- How to trade harmonic patterns
- Seven harmonic patterns to trade
- Harmonic FAQs
What are harmonic patterns?
Harmonic patterns are advanced geometric chart formations that are formed using the ratios found in Fibonacci theory. Essentially, harmonic traders take a series of Fibonacci retracements and extensions and plot them on a chart to predict future price action.
The theory behind harmonic patterns is the same as any other type of chart pattern: that price action which has led to a specific move reliably in the past will continue to do so in the future.
However, instead of forming over a handful of sessions (like candlestick patterns) or making a broad shape (like chart patterns), harmonic patterns tend to consist of a set of distinct moves – with strict rules that each stage has to conform to.
Learn more about how to read charts.
Do harmonic patterns work?
Harmonic patterns can work, and many successful trading strategies have been built off the back of them. However, with such strict rules to follow they are prone to failure – which is why they’re generally considered more advanced than other areas of technical analysis.
What that means in practice is that understanding the Fibonacci theory behind harmonic patterns is key before you start trading them. You’ll also need to maintain strict risk management at all times, to ensure that a failed pattern doesn’t cost you too much.
You might even want to get started on a risk-free demo account, which enables you to try out trading harmonic patterns without putting up any of your own capital.
How to trade harmonic patterns
To trade a harmonic pattern, you open a position once the pattern completes, to take advantage of the market’s next predicted move. However, before you trade, you’ll want to confirm that the pattern has completed – and ensure that each move confirms to the strict Fibonacci rules we set out below.
Then to start trading them with City Index, follow these steps:
- Open your City Index trading account
- Log in to our award-winning online trading platform, download our mobile trading apps or access third-party tools including MT4 and TradingView
- Start looking for harmonic patterns across 1,000s of financial markets
- Open your position
7 harmonic patterns you need to know
Now that we’ve covered the basics, let’s take a look at the main harmonic patterns you might encounter in your technical analysis.
Many of these patterns were first identified by the same trader: Scott Carney, who coined the term harmonic patterns and has popularised their usage in the last couple of decades.
ABCD pattern
The ABCD pattern consists of three lines that move between four points, which are labelled A, B, C and D – hence the name. It is one of the simplest harmonic patterns you’ll encounter.
In an ABCD, the market starts with a move from A to B, which can be up or down. The move from B to C is then ‘corrective’ – meaning it moves against first AB line. Then finally we have the C to D move, which is in line with AB one again.
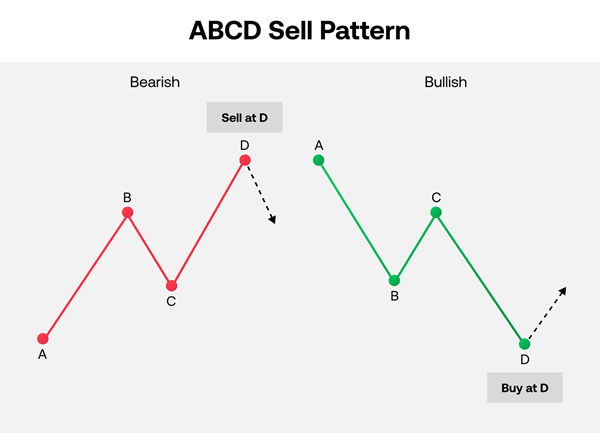
The theory is that upon completion, the market should make another corrective move, which you can use to target profit.
ABCDs can be either bearish or bullish depending on the direction of the swings. If the pattern points upwards (so AB points up and B and D are at the top) it is considered bearish, and if it points down (with AB pointing down and A and C at the top) it is bullish.
ABCD harmonic pattern rules
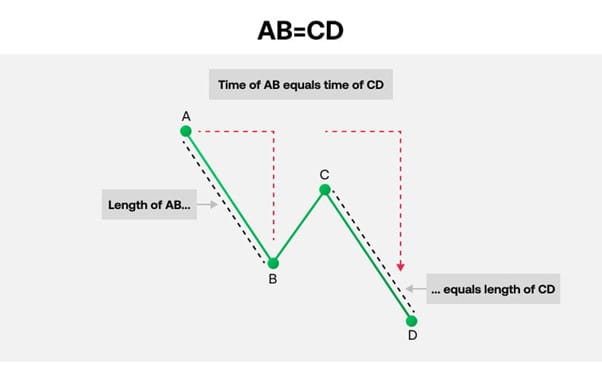
- The first rule of an ABCD pattern is that the AB and CD moves should be equal in both size and time. If the market moves up 50 points in two hours from A to B, then it should do the same for C to D (although the pattern may also still be valid if CD is an extension of AB)
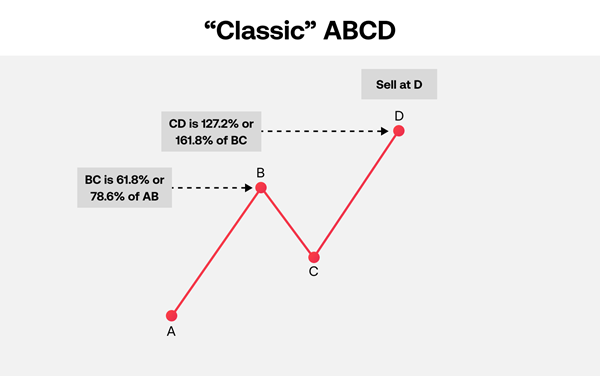
- Additionally, the BC line should be a Fibonacci retracement of AB, ending at either 61.8% or 78.6% of the original move
- The CD line should be a 127.2% or 161.8% retracement of BC
Gartley harmonic pattern
The Gartley harmonic pattern is named after the trader who first identified it, H.M. Gartley. It is essentially an ABCD with an extra move in front of it, which is typically labelled ‘X’. The move from X to A sets up a trend before the rest of the pattern takes hold, which should then continue after the pattern completes.
This makes Gartleys continuation patterns.
- In a bullish Gartley pattern, the move from X to A is an uptrend. The market then consolidates from A to D, before the uptrend resumes after D
- In a bearish Gartley pattern, XA is a downtrend, which resumes after D
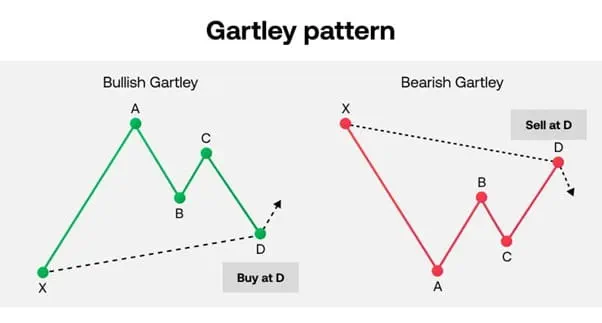
Most harmonic traders refer to the area at D as a ‘potential reversal zone’, or PRZ for short. It isn’t a specific point, but an area in which a reversal becomes likely.
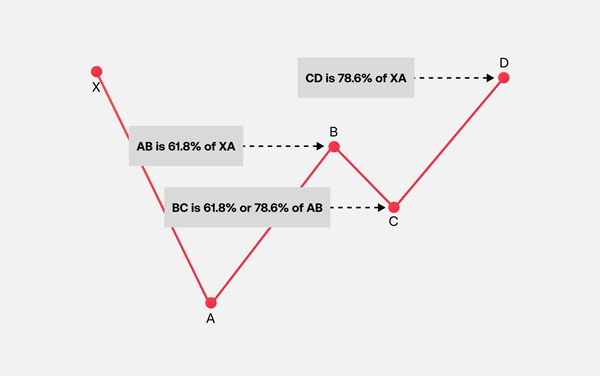
Gartley pattern rules
- The AB line should be a 61.8% retracement of XA
- BC should then be a 61.8% or 78.6% retracement of AB
- The CD line should end at a 78.6% retracement of XA
You can think of a Gartley as similar to a flag pattern, but with stricter rules governing the moves.
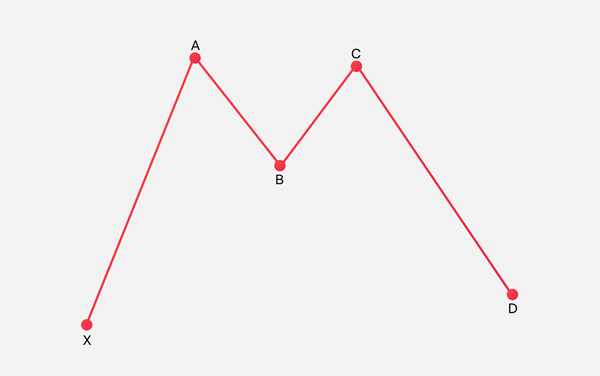
Bat harmonic pattern
Like the Gartley, the bat pattern is made up of an XABCD move, with a major trend from X to A that retraces from A to D, then continues once the pattern completes.
But this time, it gets its name because it resembles a bat on chart. This is because the retracements involved are slightly different to the Gartley pattern, giving it a different overall appearance.
Like most harmonic patterns, the bat has both a bullish and a bearish variant.
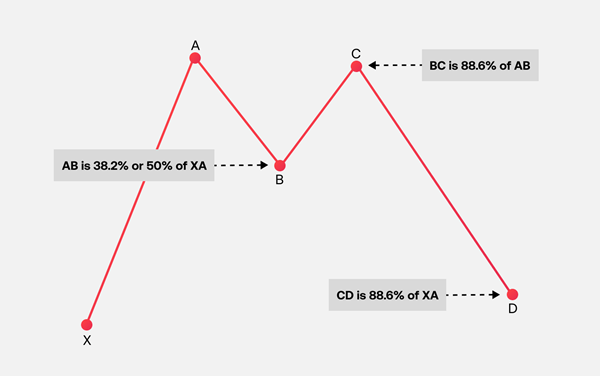
Bat pattern rules
- Here, the AB line should be a 38.2% or 50% retracement of the move from X to A
- BC is then a Fibonacci retracement of AB, of any length up to 88.6%
- The CD line should end at an 88.6% retracement of the original XA move. For a stronger signal, this should also be a 161.8%-261.8% extension of BC
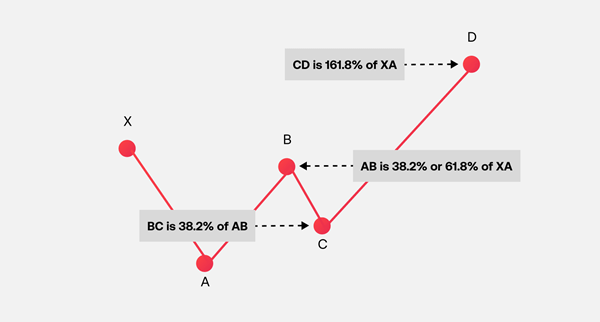
Crab harmonic pattern
Scott Carney has stated that he believes the crab pattern is the most reliable of all the harmonics. Like the bat pattern, the crab is essentially similar to a Gartley but with different ratios involved – and again indicates that the original XA move will resume at D, a PRZ.
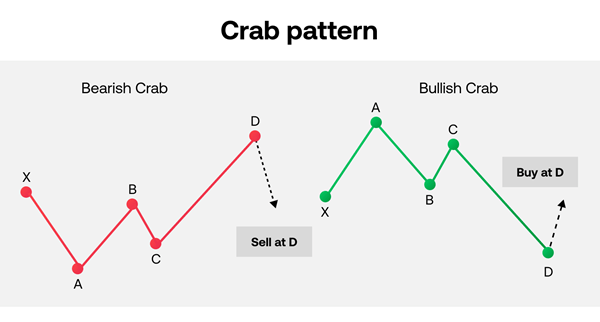
The crucial difference in a crab is that D is an extension of the original XA move, meaning that point D is actually above (for bearish crabs) or below (bullish) point X.
Crab pattern rules
- AB should be a 38.2% or 61.8% retracement of XA
- BC should then be a 38.2% or 61.8% retracement of AB
- CD should be a 161.8% retracement of XA
There’s also the ‘deep crab’, a variant of the crab pattern where point B is an 88.6% retracement of XA. This in effect combines the crab and bat patterns.
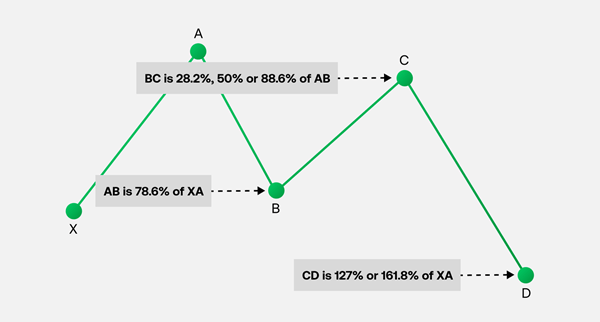
Butterfly harmonic pattern
Another harmonic that’s based on the Gartley pattern is the butterfly, which is formed from a Gartley but with a 78.6% retracement of XA at AB. Like the crab, this means that point D will end up beyond X.
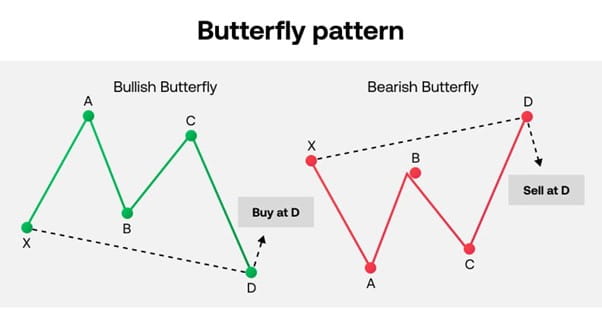
The Butterfly harmonic was discovered by Bryce Gillmore.
Butterfly pattern rules
- AB is a 78.6% retracement of XA
- BC is then either a 38.2%, 50% or 88.6% retracement of AB
- CD should be a 127% 0r 161.8% retracement of XA
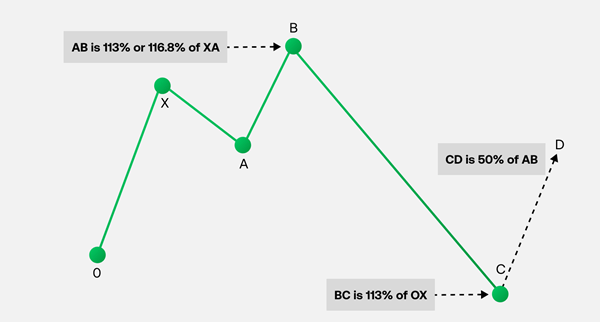
Shark harmonic pattern
Finally, let’s cover two more recent harmonic patterns, both discovered by Scott Carney. First up is the shark, which like the butterfly is broadly similar to a crab but works a bit differently.
We’ve covered ABCD and XABCD patterns. The shark adds another point in front to form an OXABCD, but doesn’t use D as the PRZ at which you open your trade – instead, D becomes your profit target.
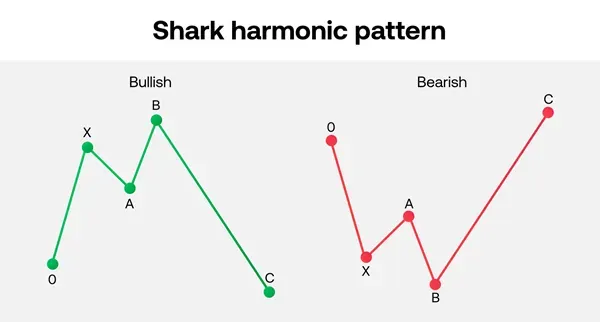
In a shark, the market forms an initial trend at OX, which retraces at XA, resumes at AB then deeply retraces at BC. At C, the original trend resumes.
Shark pattern rules
- The AB leg should be a 113% or 116.18% retracement of XA
- BC is a 113% retracement of the original OX move
- Point D is a 50% retracement of BC
5 0 harmonic pattern
The 5 0 is another OXABCD pattern, but this time indicates the beginning of a brand-new trend, rather than a continuation or retracement. With a 5 0, you can trade the move from C to D – or wait for the market to reverse into a new trend at D.
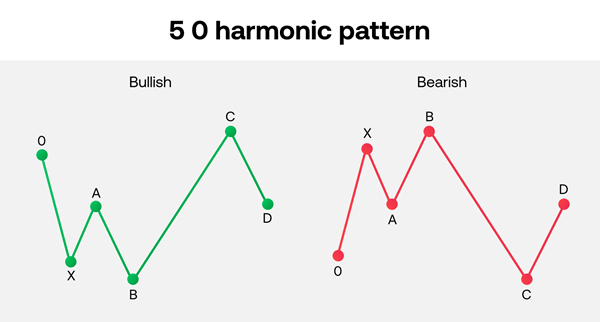
This pattern uses some unique retracements, so it looks quite different to the other harmonics we’ve covered so far.
5 0 pattern rules
- Here, AB is a 113% or 161.8% retracement of XA, resuming the trend set at OX
- BC is then a 161.8% or 224% retracement of AB, overwriting all the movement made between O and B
- The CD move is a 50% retracement of BC
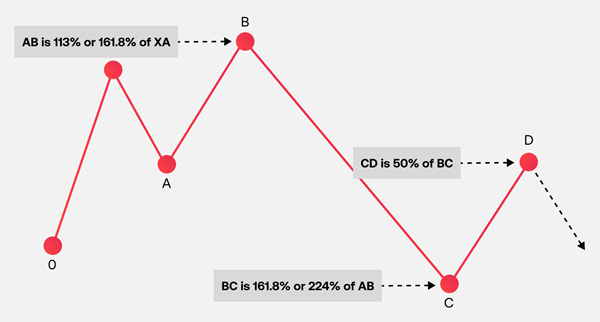
Once the market reverses again at D, a new trend should form in the opposite direction to the original move.
Harmonic patterns FAQ
Are harmonic patterns profitable?
Harmonic patterns can be profitable, but only if you trade them carefully. As we’ve covered, they can often fail and are considered valid unless a strict set of rules is followed – which makes comprehensive risk management extremely important.
How accurate are harmonic patterns?
Harmonic patterns are often highly accurate, if the pattern completes according to each Fibonacci ratio set out in its rules. However, it is a common to see a move that look like a harmonic pattern, but doesn’t quite conform to its rule – which invalidates the pattern.
This is why most harmonic traders use powerful charting tools like TradingView to make precise measurements before opening a position.
Latest market news
Yesterday 01:32 PM
Yesterday 09:35 AM
Yesterday 07:23 AM
Yesterday 04:48 AM
Yesterday 12:17 AM
July 25, 2024 10:39 PM
Latest Financial market insight articles


March 26, 2024 04:11 AM

February 24, 2024 05:10 PM

November 16, 2023 10:23 AM