

- Gold analysis: Technical levels and factors to watch
- US dollar retreats following last week’s gains
- Silver analysis: Metal looks poised for major breakout
Gold was up around 1% by mid European session, trading near $2200, while silver was up low 0.6%, trading around $24.80. Precious metals have rebounded as the dollar retreats slightly following its sharp gains the week before. Dovish policy decisions from the Federal Reserve and the Bank of England as well as a surprise rate cut by the Swiss National Bank and not to mention indications from other major central banks such as the European Central Bank that interest rates are going to be cut by the middle of this year, area all helping to support precious metals. Gold remains poised to hit new highs. But is it finally silver's time to play catch up and stage a sharp breakout?
Gold analysis: Technical levels and factors to watch
Thanks to a positive macro backdrop and ongoing bullish momentum, gold’s technical outlook remains positive. The precious metal could be heading to a new record high, possibly later this week.
The precious metal has only recently broken out of a multi-year consolidation pattern to the upside, in early March. That’s when it took out sturdy resistance around $2075 to $2080 area and posted a clean break above it. This was a significant technical development and one that is likely to play out for potentially weeks to come.
You see, the lengthier the consolidation, the stronger the move tends to be in the direction of the breakout. The 3.5-year consolidation prior to the breakout meant that there was a lot of buying that took place then, which is why it eventually caused the breakout. Therefore, it has provided us a big technical indication that gold could be heading significantly higher over time, even if there are going to be short-term pullbacks on the way.
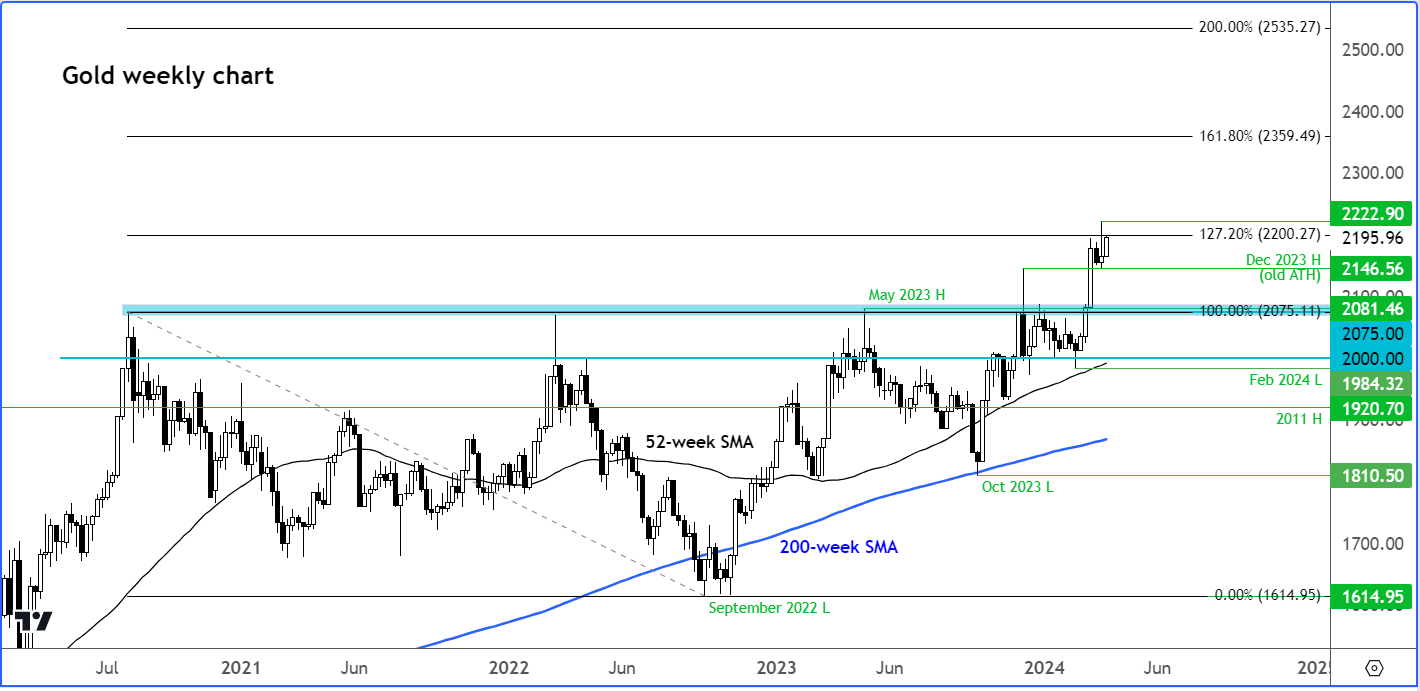
So, the long-term trend is clearly bullish as one can see from the weekly time frame. This is also echoed on the daily chart and demonstrated by the establishment of higher lows and higher highs. The bears will need to see a deviation from this sequence to imply a shift to a bearish outlook. On the weekly time frame, the most recent higher low was made at $1984 in February. A breach below this level could indicate a potential conclusion to gold's long-term bullish trend.
For now, the path of least resistance remains to the upside and traders seem happy to use any short-term weakness to buy the dip. Even if we were to see a sharp-ish short-term drop, this is unlikely to significantly impact the long-term technical outlook, with many buyers ready to seize opportunities amidst any downturns, provided the $1984 level remains intact.
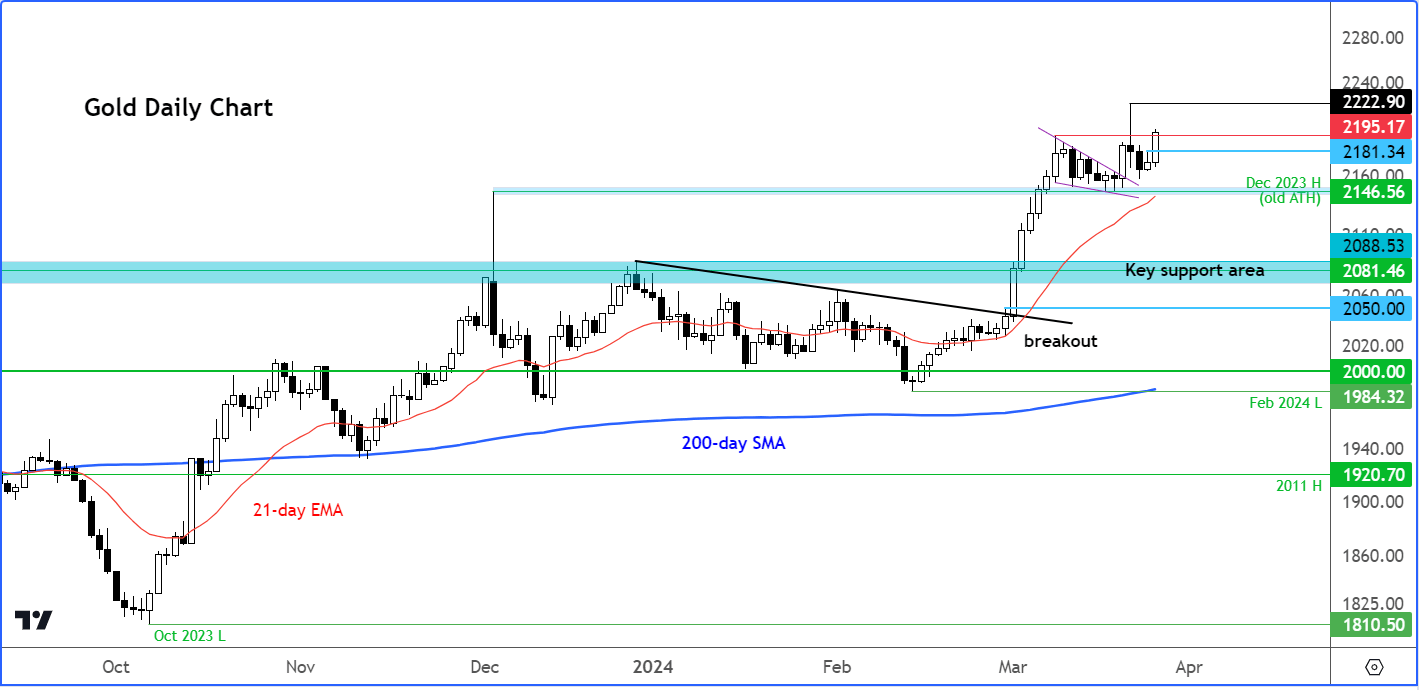
On the daily gold chart, we can see that gold has held the breakout above $2146, representing December’s high. This level acts as a reference point for short-term directional trades. A breach below it could trigger a larger correction towards the $2075 to $2081 support range, potentially presenting buying opportunities. Buy while above it, shorter-term traders will be happy to remain long and target new highs. The most logical target on the upside now is at $2222, representing the most recent record high.
In short, gold is currently residing in a strong trend. Dip-buyers appears to be in complete control for now. Former resistance levels, particularly the $2075 to $2080 range, may now serve as key support upon retesting, having previously acted as significant resistance levels in recent years.
Silver analysis: Metal looks poised for major breakout
The poor man’s gold, silver, yet to stage a similar breakout to gold. However, as you can see on the monthly chart of silver, the precious metal is coiling for a potential breakout. Silver has been stuck in consolidation ever since it staged a major breakout at the height of the pandemic in 2020, following a brief plunge below the then key support at $20. It went on to reach $30 by 2021. Since then, it has been struggling with every breakout attempt failing. But crucially, it held the long-term breakout around $20 area, albeit with a bit of deviation. A bullish trend line has been established in more recent years. Yet so far, the bearish trend has not been broken. In other words, it consolidating its post-pandemic gains for almost four years.
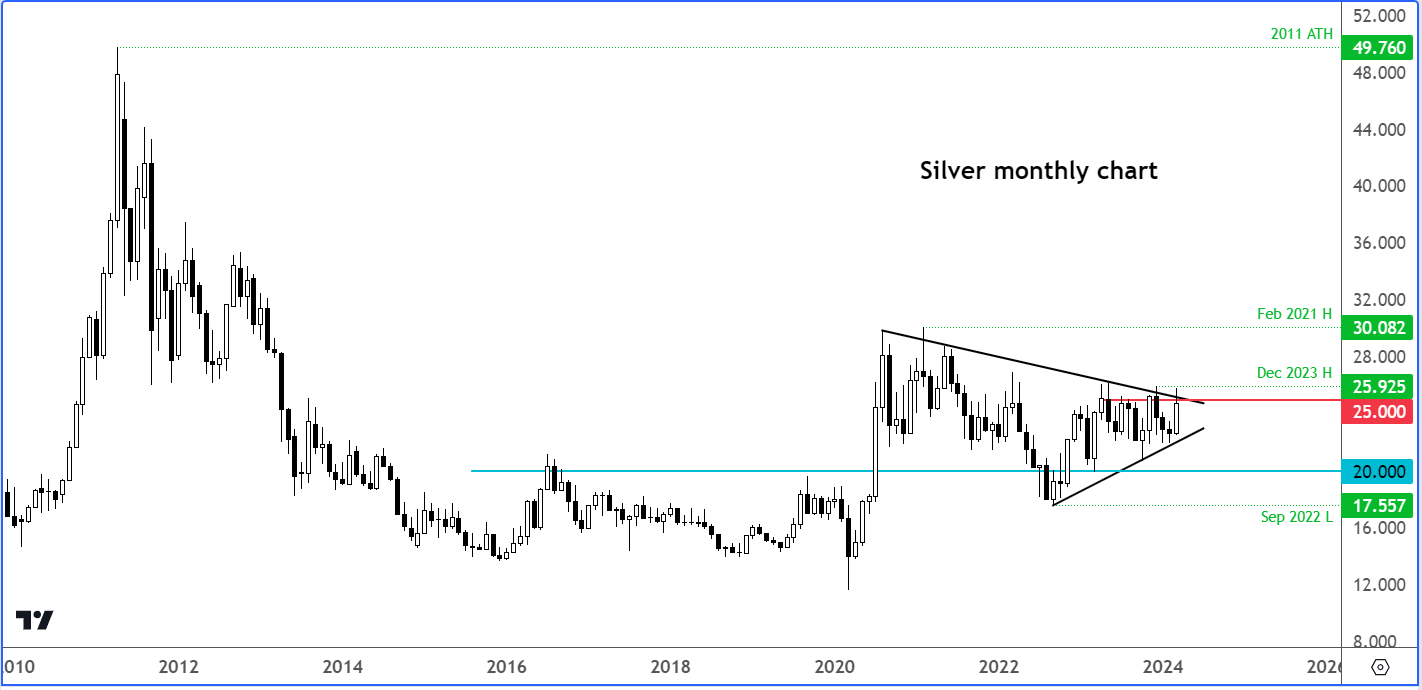
However, given the fact that gold has been breaking to new record highs and its bullish momentum gathering pace, this could help silver also stage a breakout of a similar sort. What makes me super bullish on silver is the fact that it has now spent a very long time in consolidation to the tune of 3.5 years, which means that if and when it does break to the upside, the follow-up technical buying could be as significant as the period of consolidation, meaning that silver could potentially not only head to the top of the range at $30 but it could potentially climb well above that and head towards its all-time high near $50.
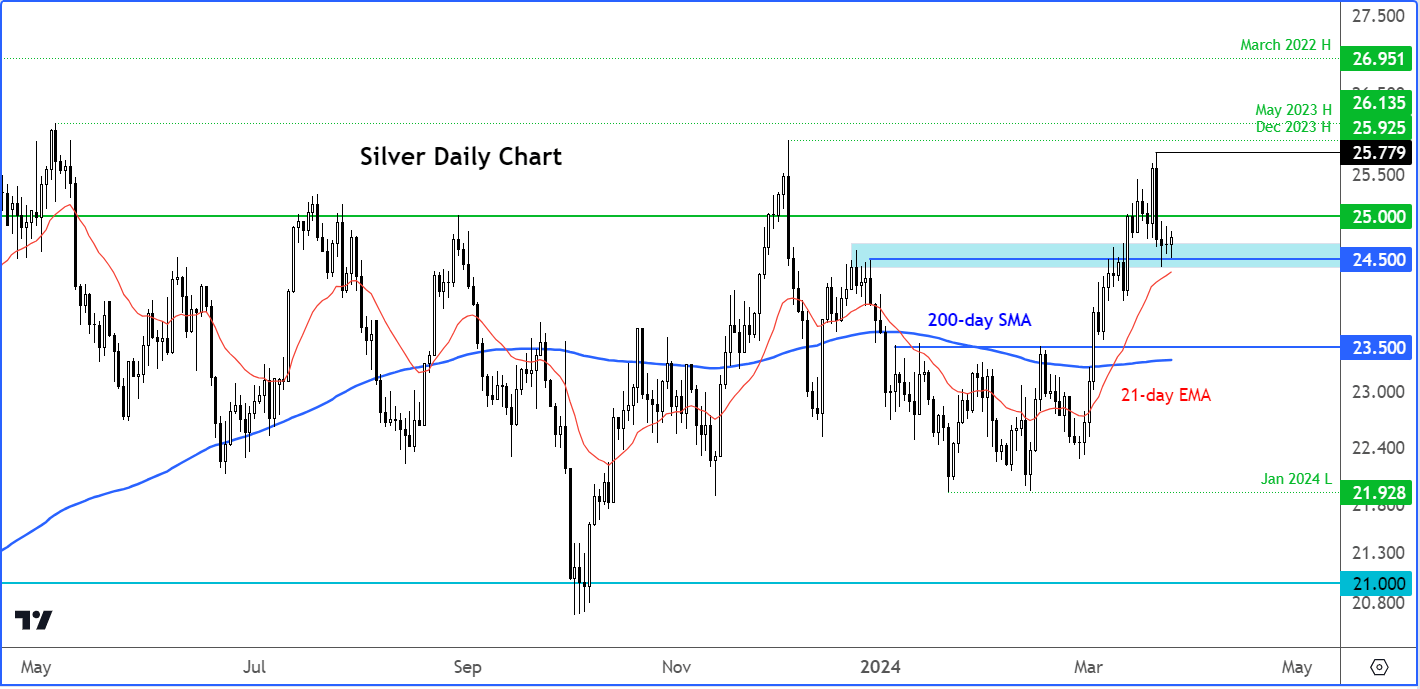
On the on the daily chart, you can see that silver is holding its own above the 21-day exponential moving average, which has only recently broken above the 200-day moving average to provide us with a short-term technical signal. Most recently, silver broke above $25 and almost reached the December high at $25.92, before pulling back to drop along with major currency pairs. However, the weakness has not led to a proper sell off and it has instead consolidated around key support near $24.50. This level is going to be very important moving forward. While $24.50, holds I think there is a good chance that silver could start its next move up from around current levels.
At the time of writing, silver was looking bullish in that it had turned positive on the day and looking to break above previous day’s range. A daily close around current levels or ideally above $25 could provide a strong technical indication that perhaps silver is ready to launch.
Source for all charts used in this article: TradingView.com

-- Written by Fawad Razaqzada, Market Analyst
Follow Fawad on Twitter @Trader_F_R
How to trade with City Index
You can trade with City Index by following these four easy steps:
-
Open an account, or log in if you’re already a customer
• Open an account in the UK
• Open an account in Australia
• Open an account in Singapore
- Search for the company you want to trade in our award-winning platform
- Choose your position and size, and your stop and limit levels
- Place the trade
Latest market news
Yesterday 01:32 PM
Yesterday 09:35 AM
Yesterday 07:23 AM
Yesterday 04:48 AM
Yesterday 12:17 AM
July 25, 2024 10:39 PM
Latest Gold articles

Yesterday 09:35 AM

July 25, 2024 05:30 AM
July 23, 2024 05:20 PM
July 23, 2024 03:17 AM