

Asian Indices:
- Australia's ASX 200 index rose by 36.2 points (0.54%) and currently trades at 6,684.20
- Japan's Nikkei 225 index has risen by 158.32 points (0.6%) and currently trades at 26,648.85
- Hong Kong's Hang Seng index has risen by 15.04 points (0.07%) and currently trades at 21,658.62
- China's A50 Index has risen by 45.74 points (0.31%) and currently trades at 14,784.51
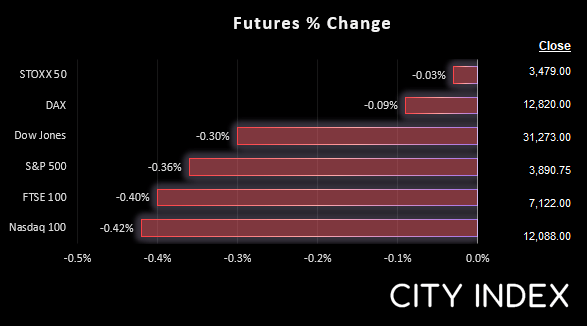
UK and Europe:
- UK's FTSE 100 futures are currently down -28.5 points (-0.4%), the cash market is currently estimated to open at 7,160.58
- Euro STOXX 50 futures are currently down -1 points (-0.03%), the cash market is currently estimated to open at 3,487.50
- Germany's DAX futures are currently down -11 points (-0.09%), the cash market is currently estimated to open at 12,832.22
US Futures:
- DJI futures are currently down -95 points (-0.3%)
- S&P 500 futures are currently down -52 points (-0.43%)
- Nasdaq 100 futures are currently down -14.5 points (-0.37%)
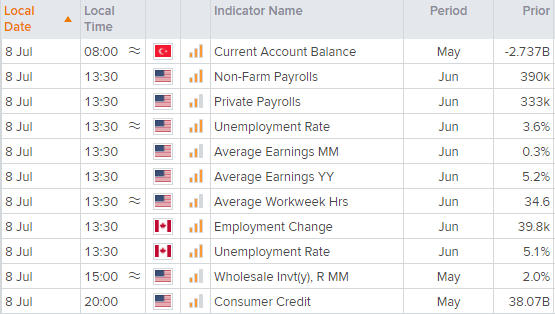
US vs Canadian employment reports at 13:30 BST
Employment reports usually catch trader’s attention, but today we have employment reports for the US and Canada released together for added excitement. Expectations are for Canada’s employment growth to continue to soften and unemployment remain flat at 5.1%. A similar pattern is apparent for US data with growth set to soften and unemployment remain at 3.6%. Obviously, the last thing traders want is for data to come in as expected - as we crave a divergence. Therefore a strong US report compared with a weaker Canadian report should be bullish for USD/CAD, or send it lower should US data disappoint relative to Canadian data. However, another way to play this is via oil (which tends to benefit the Canadian dollar if it rises).
WTI futures – 1-hour chart
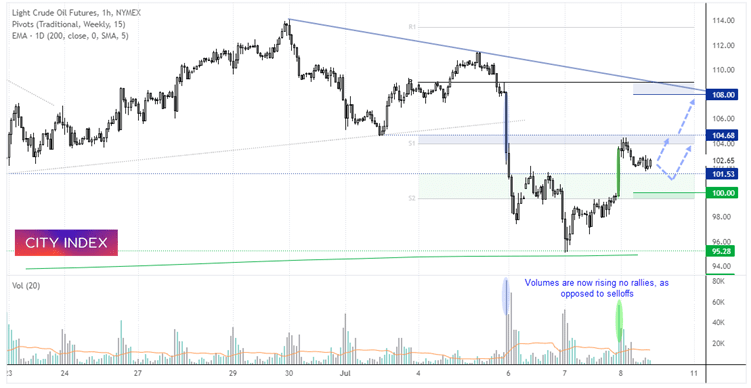
Energy prices are on the rebound which has sent WTI to a 2-day high and produce a bullish engulfing yesterday. Notice how a key low formed at 95.28 near the 200-day eMA, bullish momentum has since turned higher. Furthermore, spikes of volume now accompany rising prices as opposed to bearish moves, so I suspect there’s more upside potential for oil. The bias remains bullish above the $100 support zone but $101.50 may also provide support. A break above $104.70 brings the $108 resistance zone into focus.
How to start oil trading
FTSE 350 – Market Internals:
FTSE 350: 3990.68 (1.14%) 07 July 2022
- 278 (79.20%) stocks advanced and 60 (17.09%) declined
- 5 stocks rose to a new 52-week high, 9 fell to new lows
- 18.8% of stocks closed above their 200-day average
- 98.29% of stocks closed above their 50-day average
- 11.11% of stocks closed above their 20-day average
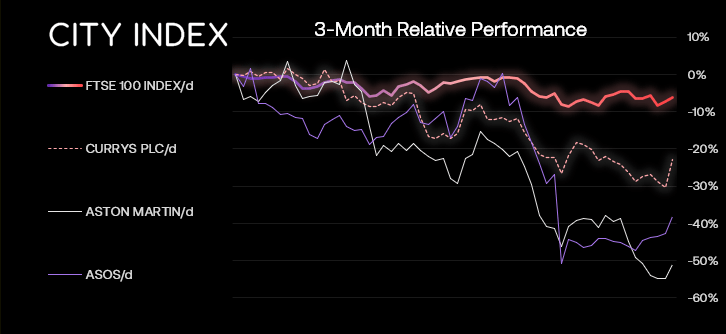
Outperformers:
- + 10.5% - Currys PLC (CURY.L)
- + 8.21% - Aston Martin Lagonda Global Holdings PLC (AML.L)
- + 8.09% - ASOS PLC (ASOS.L)
Underperformers:
- -8.84% - Baltic Classifieds Group PLC (BCG.L)
- -4.96% - Persimmon PLC (PSN.L)
- -4.12% - Flutter Entertainment PLC (FLTRF.L)
Economic events up next (Times in BST)
How to trade with City Index
You can easily trade with City Index by using these four easy steps:
-
Open an account, or log in if you’re already a customer
• Open an account in the UK
• Open an account in Australia
• Open an account in Singapore
- Search for the company you want to trade in our award-winning platform
- Choose your position and size, and your stop and limit levels
- Place the trade
Latest market news
Yesterday 01:32 PM
Yesterday 09:35 AM
Yesterday 07:23 AM
Yesterday 04:48 AM
Yesterday 12:17 AM
July 25, 2024 10:39 PM
Latest Technical Analysis articles

July 25, 2024 03:59 PM

July 24, 2024 07:26 PM

July 24, 2024 09:55 AM

July 23, 2024 11:58 AM