

Asian Indices:
- Australia's ASX 200 index fell by -42.9 points (-0.59%) and currently trades at 7,243.10
- Japan's Nikkei 225 index has fallen by -180.31 points (-0.65%) and currently trades at 27,472.43
- Hong Kong's Hang Seng index has fallen by -322.79 points (-1.17%) and currently trades at 27,166.99
UK and Europe:
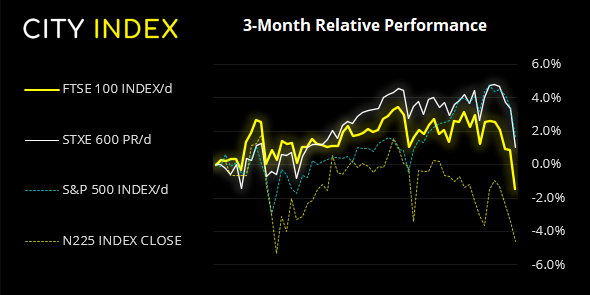
- UK's FTSE 100 futures are currently down -8 points (-0.12%), the cash market is currently estimated to open at 6,836.39
- Euro STOXX 50 futures are currently up 4.5 points (0.11%), the cash market is currently estimated to open at 3,933.03
- Germany's DAX futures are currently up 27 points (0.18%), the cash market is currently estimated to open at 15,160.20
US Futures:
- DJI futures are currently down -725.81 points (-2.09%)
- S&P 500 futures are currently up 52.75 points (0.36%)
- Nasdaq 100 futures are currently up 8.25 points (0.19%)
Learn how to trade indices
Indices
The Nikkei fell to its lowest level in 7-months overnight as growth concerns continue to weigh on investor sentiment. All though it was Singapore’s STI which led declines across Asia, falling -1.3%. The ASX 200 initially fell over -1% and probed the June low, yet stability was found at trend support from the November low. This effectively keeps it in range and is another clue that equity selling could being to subside. US futures have opened slightly higher although FTSE 100 futures are currently -0.1% down.
The FTSE 100 is another market which could be sat at a technical juncture. After falling for most of the session yesterday it posted a mild (yet potentially important) rebound to close above the 6823.60 low. But a noteworthy characteristic of the FTSE is its ability to quickly reverse course after a bad day, which leaves potential for a higher bounce above the May low. But we’d likely need to see it trade above 6900 before it stands any chance of a decent rally.
FTSE 350: Market Internals
FTSE 350: 3925.17 (-2.34%) 19 July 2021
- 15 (4.27%) stocks advanced and 332 (94.59%) declined
- 4 stocks rose to a new 52-week high, 30 fell to new lows
- 66.95% of stocks closed above their 200-day average
- 99.43% of stocks closed above their 50-day average
- 15.1% of stocks closed above their 20-day average
Outperformers:
- + 3.25% - Just Eat Takeaway.com NV (TKWY.AS)
- + 2.91% - Biffa PLC (BIFF.L)
- + 1.31% - Pearson PLC (PSON.L)
Underperformers:
- -10.1% - Cineworld Group PLC (CINE.L)
- -8.27% - Carnival PLC (CCL.L)
- -7.23% - Spire Healthcare Group PLC (SPI.L)
Forex:
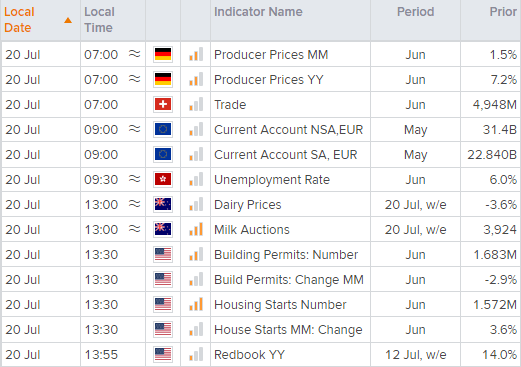
German producer prices are released at 07:00 BST, the current account for the eurozone is released at 09:00. It’s doubtful if either could trigger a meaningful reaction given yesterday’s volatility, so today’s session is really about trying to decipher if the if selling or sentiment is due another dip.
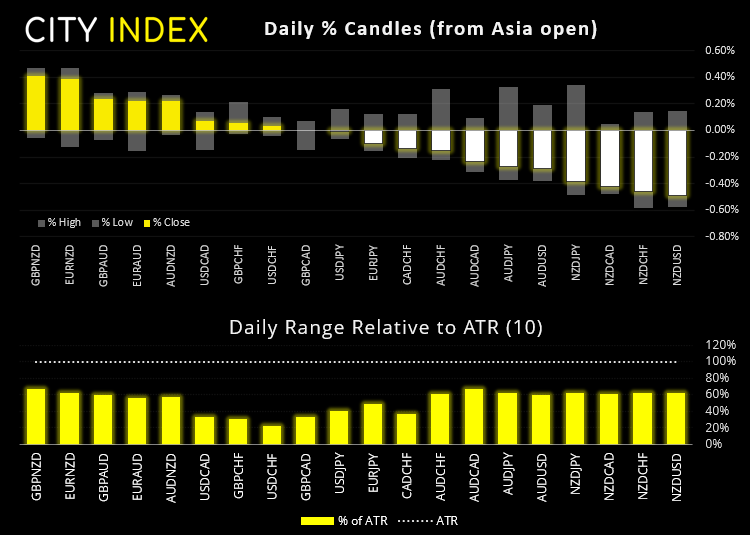
Volatility was a former shadow of itself overnight with a currency pairs confined to tight ranges. Commodity FX pairs remained anchored near their lows whilst JPY and USD remained firm, even if there was no obvious signs of buying of these safe havens.
GBP/USD is effectively sat on the March and April lows, with neither buyers nor sellers willing to make a first move. This explains many of the pairs, so it looks like we need to see which direction UK trade takes them as it feels like a flip of a coin at present.
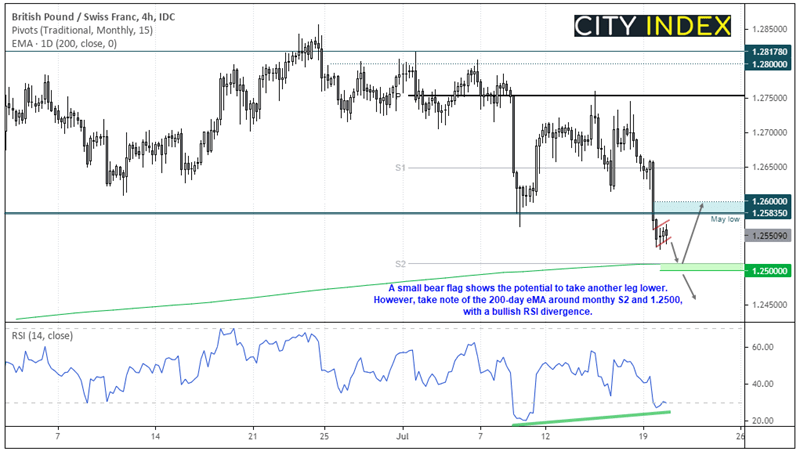
GBP/CHF saw a clear close beneath the May low yesterday, and remained anchored to its lows overnight. A small bear-flag is forming on the four-hour chart to suggest prices may try to take another dip lower. However, take note that 1.2500 may be a tough level to crack initially as it houses the 200-day eMA and monthly S2 pivot. If prices are to reverse higher then a break back above 1.2600 suggests a new trend is underway.
Learn how to trade forex:
Commodities:
Copper futures rose 0.7% but our bias remains bearish beneath the 4.344 high and for a run towards $4.00.
Brent futures closed below 70.0 for a second session and trying to hold above trend support on the daily chart. WTI finds itself in a similar situation, so view today’s video for a closer look.
Gold appears to be dazed and confused after two volatile sessions, both of which closed just above the 200-day eMA following volatile reactions either side of it. There are prettier charts to be focusing on now in our view. Such as silver, which closed firmly below its 200-day eMA and momentum continues to favour our bearish bias whilst prices remains beneath yesterday’s high.
Up Next (Times in BST)
You can view all the scheduled events for today using our economic calendar, and keep up to date with the latest market news and analysis here.
How to trade with City Index
Follow these easy steps to start trading with City Index today:
- Open a City Index account, or log-in if you’re already a customer.
- Search for the market you want to trade in our award-winning platform.
- Choose your position and size, and your stop and limit levels.
- Place the trade.
Latest market news
Yesterday 01:32 PM
Yesterday 09:35 AM
Yesterday 07:23 AM
Yesterday 04:48 AM
Yesterday 12:17 AM
July 25, 2024 10:39 PM
Latest Indices articles

July 25, 2024 01:30 PM

July 25, 2024 01:01 AM

July 25, 2024 12:41 AM

July 24, 2024 07:26 PM