
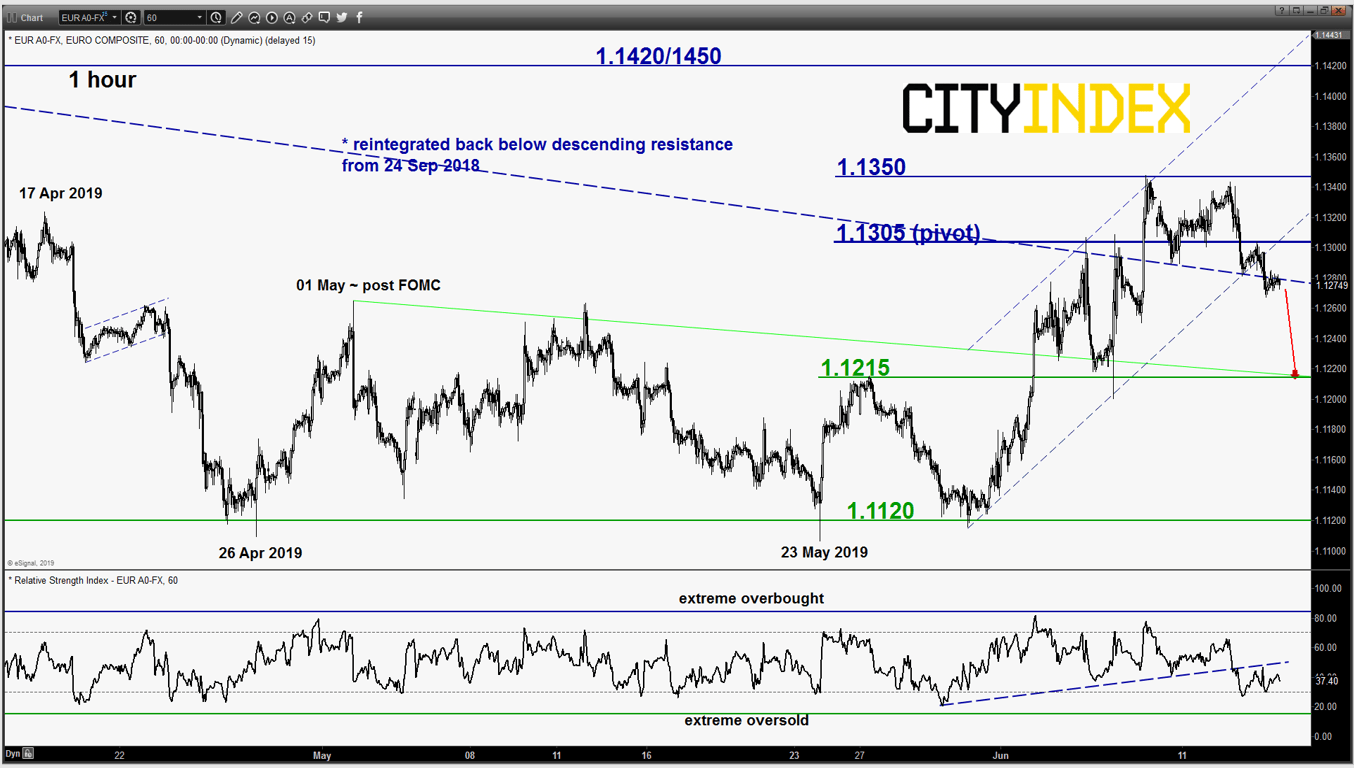
EUR/USD – Failure bullish breakout
click to enlarge chart
- Broke below the 1.1290 key short-term pivotal support in yesterday, 13 Jun U.S. session that invalidated the bullish bias as per highlighted in our previous report (click here for a recap).
- The pair has also reintegrated back below the descending resistance from 24 Sep 2018 swing high area and broke below the minor ascending channel support in place since 30 May 2019 low. In addition, short-term momentum remains negative as indicated by the 1-hour RSI oscillator.
- Flip to a bearish bias with 1.1305 as the short-term pivotal resistance for a potential slide to retest the next near-term support at 1.1215. However, an hourly close above 1.1305 reignites the bulls to retest last week’s post NFP swing high at 1.1350 before targeting the next resistance at 1.1420/1450 (also the major descending trendline in place since 15 Feb 2018 & the 20 Mar 2019 swing high area).
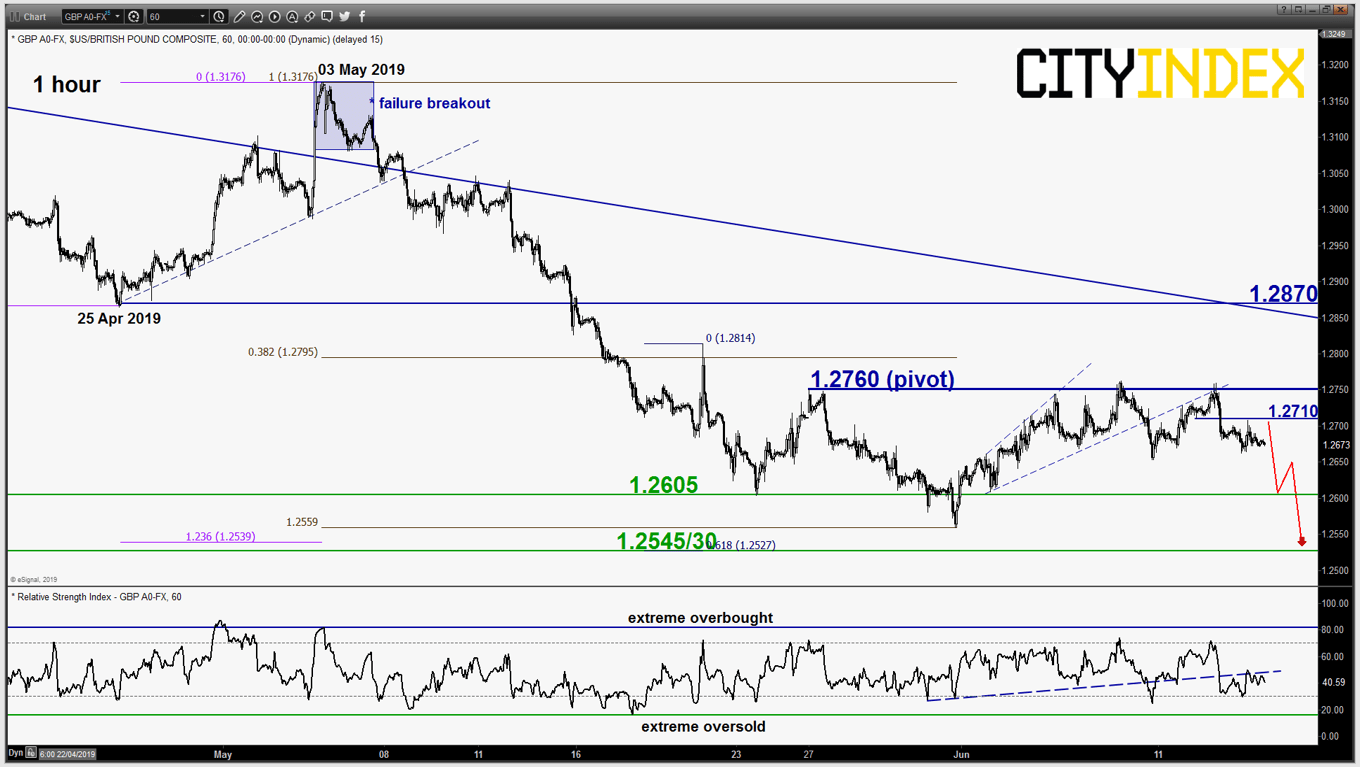
GBP/USD – Bulls remain lacklustre below 1.2760 key resistance
click to enlarge chart
- Maintain bearish bias with adjusted the key short-term pivotal resistance at 1.2760 (the minor rang top in place since 27 May 2019) for a further potential push down to retest 1.2605 and a break below it reinforces a further slide towards the major support of 1.2545/30 (also the primary ascending range support in place since 07 Oct 2016 low).
- However, an hourly close above 1.2760 invalidates the bearish scenario for an extension of the corrective rebound towards the 1.2870 key medium-term resistance (also the descending trendline from 13 Mar 2019).
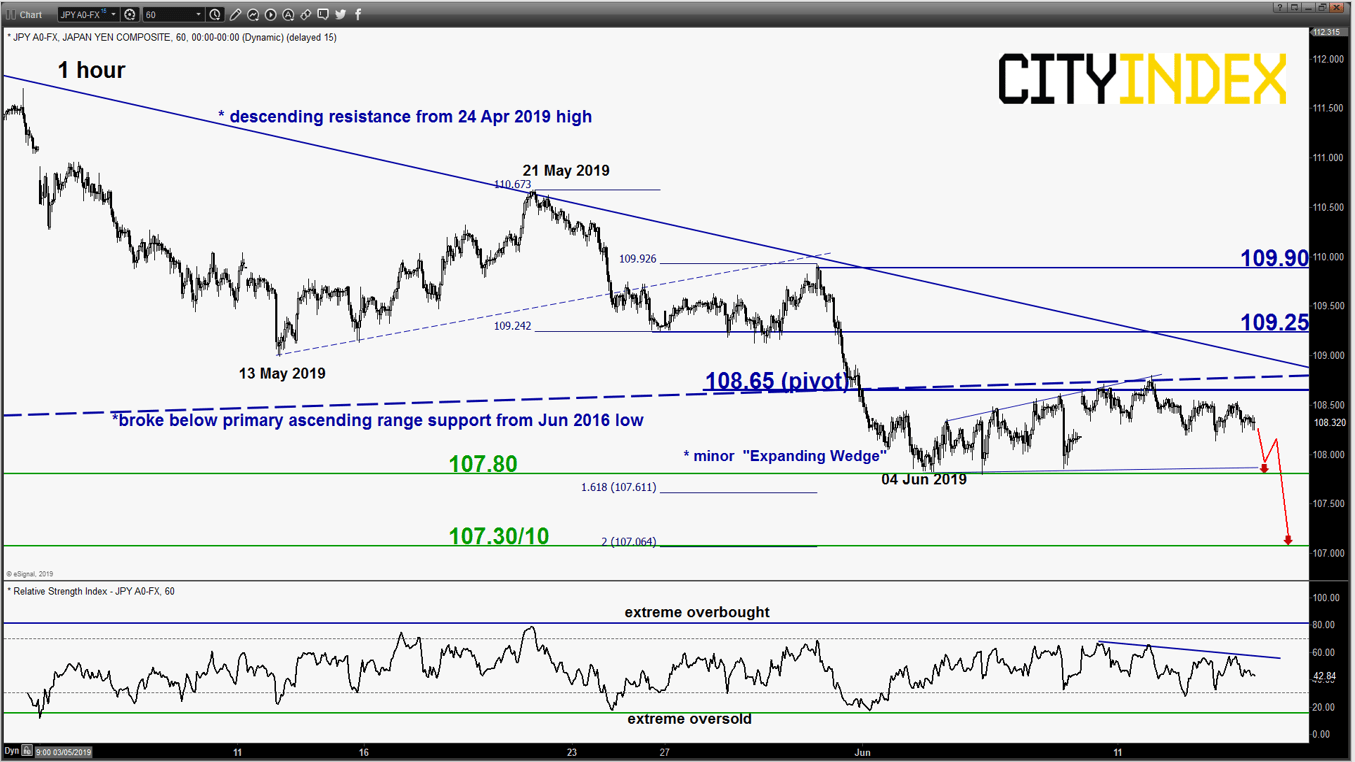
USD/JPY – 108.65 remains the key resistance to watch
click to enlarge chart
- Maintain bearish bias below 108.65 key short-term pivotal resistance for a potential drop to retest 107.80 and a break below it reinforces a further slide towards the next near-term support at 107.30/10 (Fibonacci expansion cluster).
- However, an hourly close above 108.65 invalidates the bearish scenario for a squeeze up to retest the next intermediate resistance at 109.25 (also the descending trendline resistance in place since 24 Apr 2019 high that has capped previous bounces).
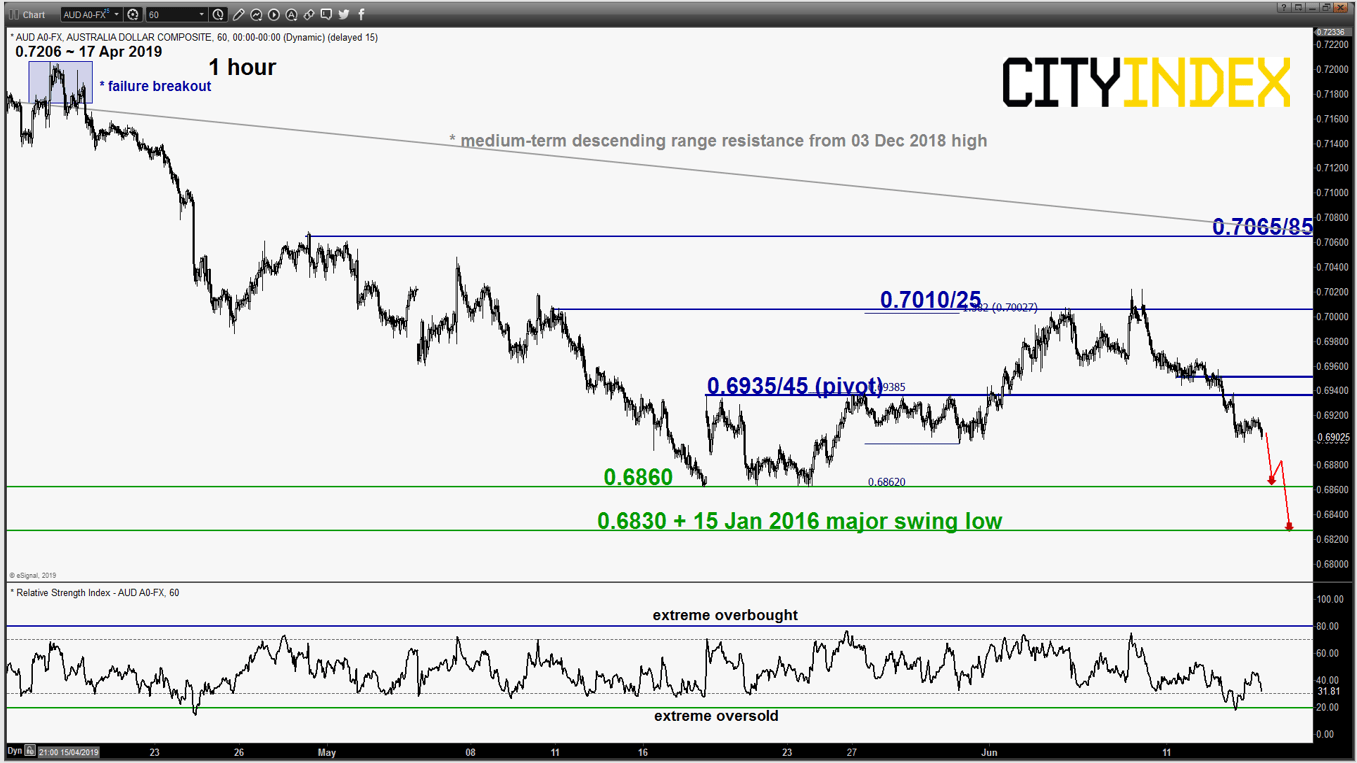
AUD/USD – Further push down in progress
click to enlarge chart
- Continued to inch down lower as expected and broke below the 0.6935 minor downside trigger level as per highlighted in our previous report. Maintain bearish bias with an adjusted key short-term pivotal resistance now at 0.6945 for a further potential push down to retest the 0.6860 recent range support and a break below it sees a further slide towards the next support at 0.6830 (Fibonacci retracement/expansion cluster & the 15 Jun 2016 major swing low).
- However, an hourly close above 0.6945 negates the bearish tone for a squeeze up to retest the 05/08 Jun 2019 swing high area at 0.7010/7025.
Charts are from eSignal
Latest market news
April 25, 2024 03:09 PM
April 25, 2024 03:00 PM
April 25, 2024 01:12 PM
April 25, 2024 11:14 AM
Latest EUR articles

April 13, 2024 08:00 PM
March 25, 2024 02:55 AM

January 22, 2024 04:19 AM
January 18, 2024 04:46 AM