
Medium-term outlook on AAC Technologies (2018 HKG)
click to enlarge charts
Key Levels (1 to 3 weeks)
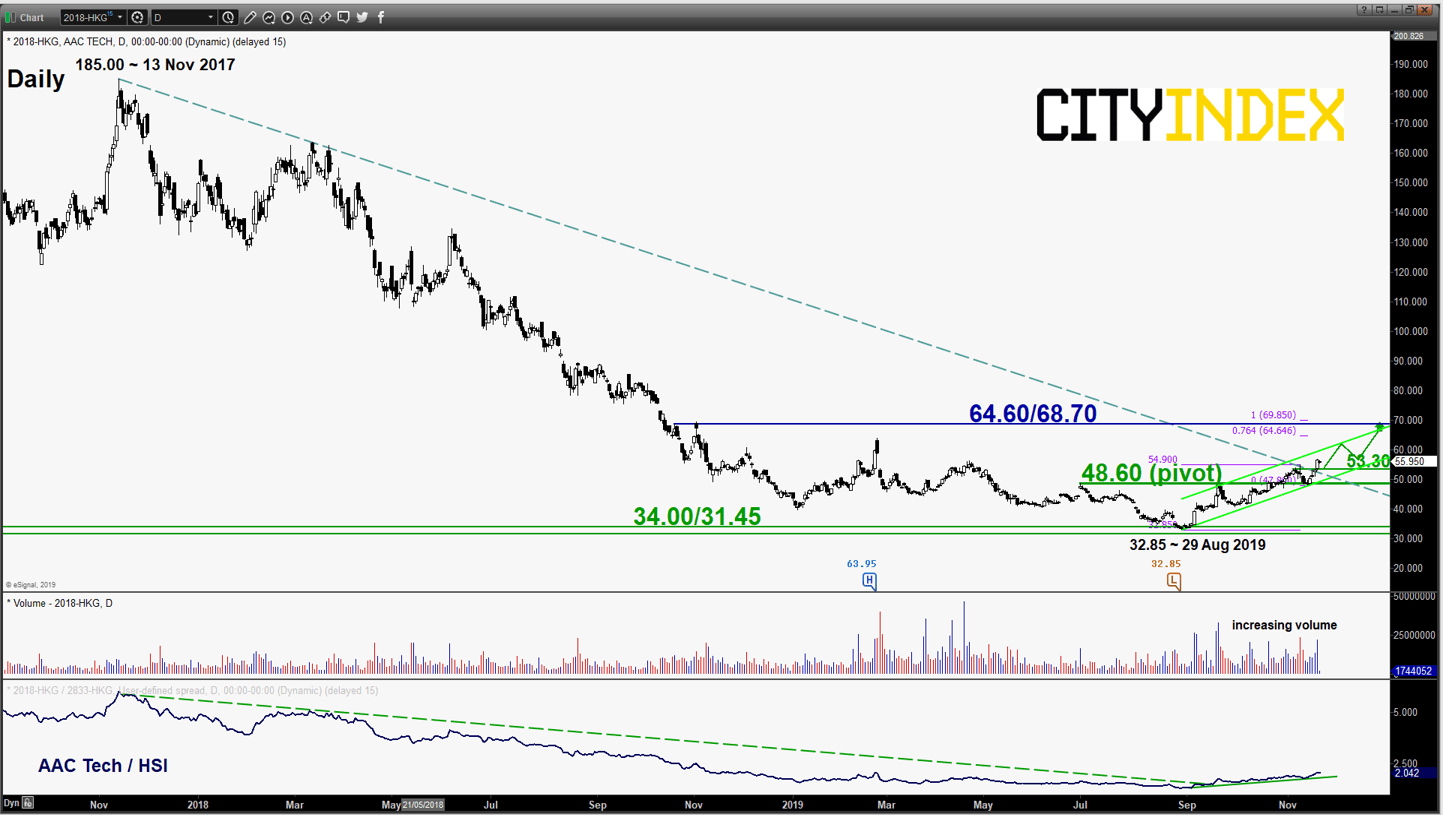
Intermediate support: 53.30
Pivot (key support): 48.60
Resistance: 64.60/68.70
Next support: 34.00/31.45 (major/LT pivot)
Directional Bias (1 to 3 weeks)
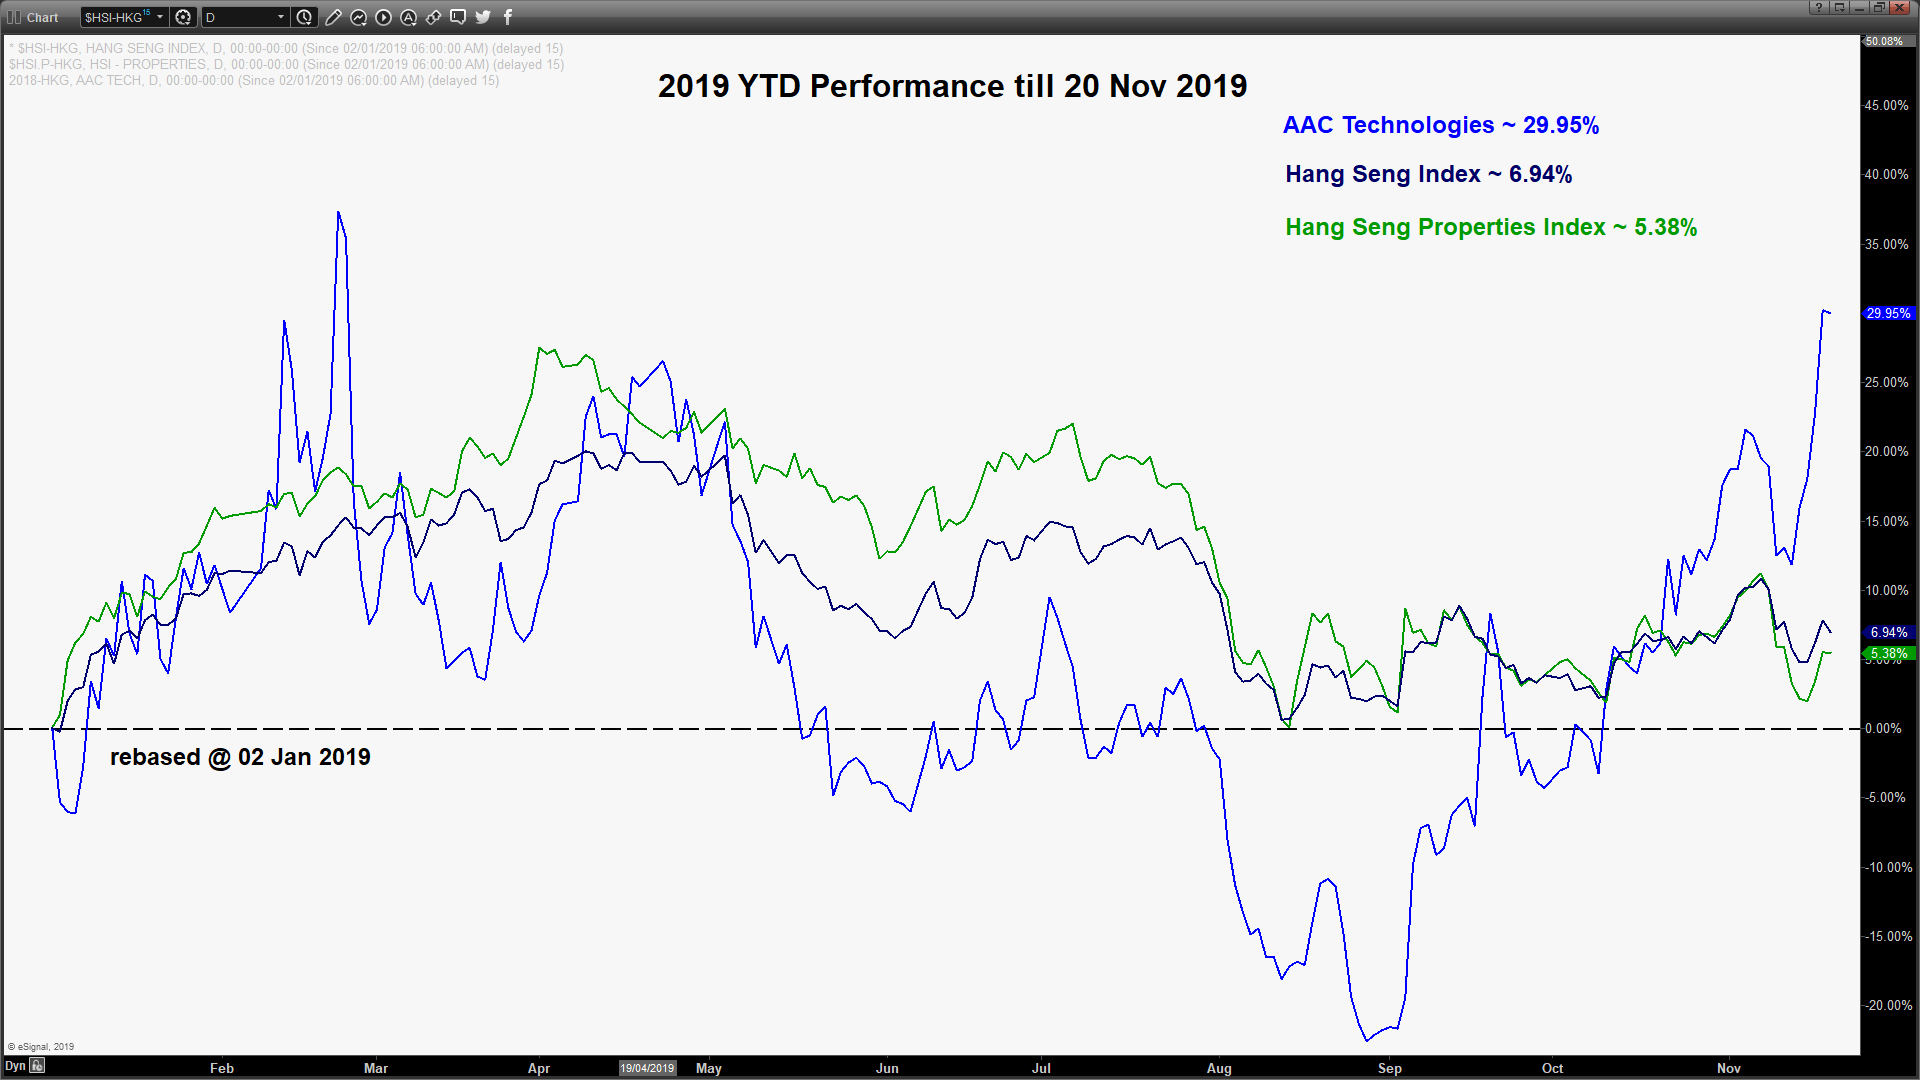
AAC Technologies is a component stock in the Hang Seng Index that involves in research, development and sale of acoustic products and electronic components in the consumer electronics industry worldwide; also supplier for Apple.
Bullish bias in any dips above 48.60 key medium-term pivotal support for a further potential upleg to target the next resistance at 64.60/68.70.
However, failure to hold at 48.60 with a daily close below it indicates a failure bullish breakout move where its share price is likely to see a further drift down to retest the 34.00/31.45 long-term/major pivotal support zone.
Key elements
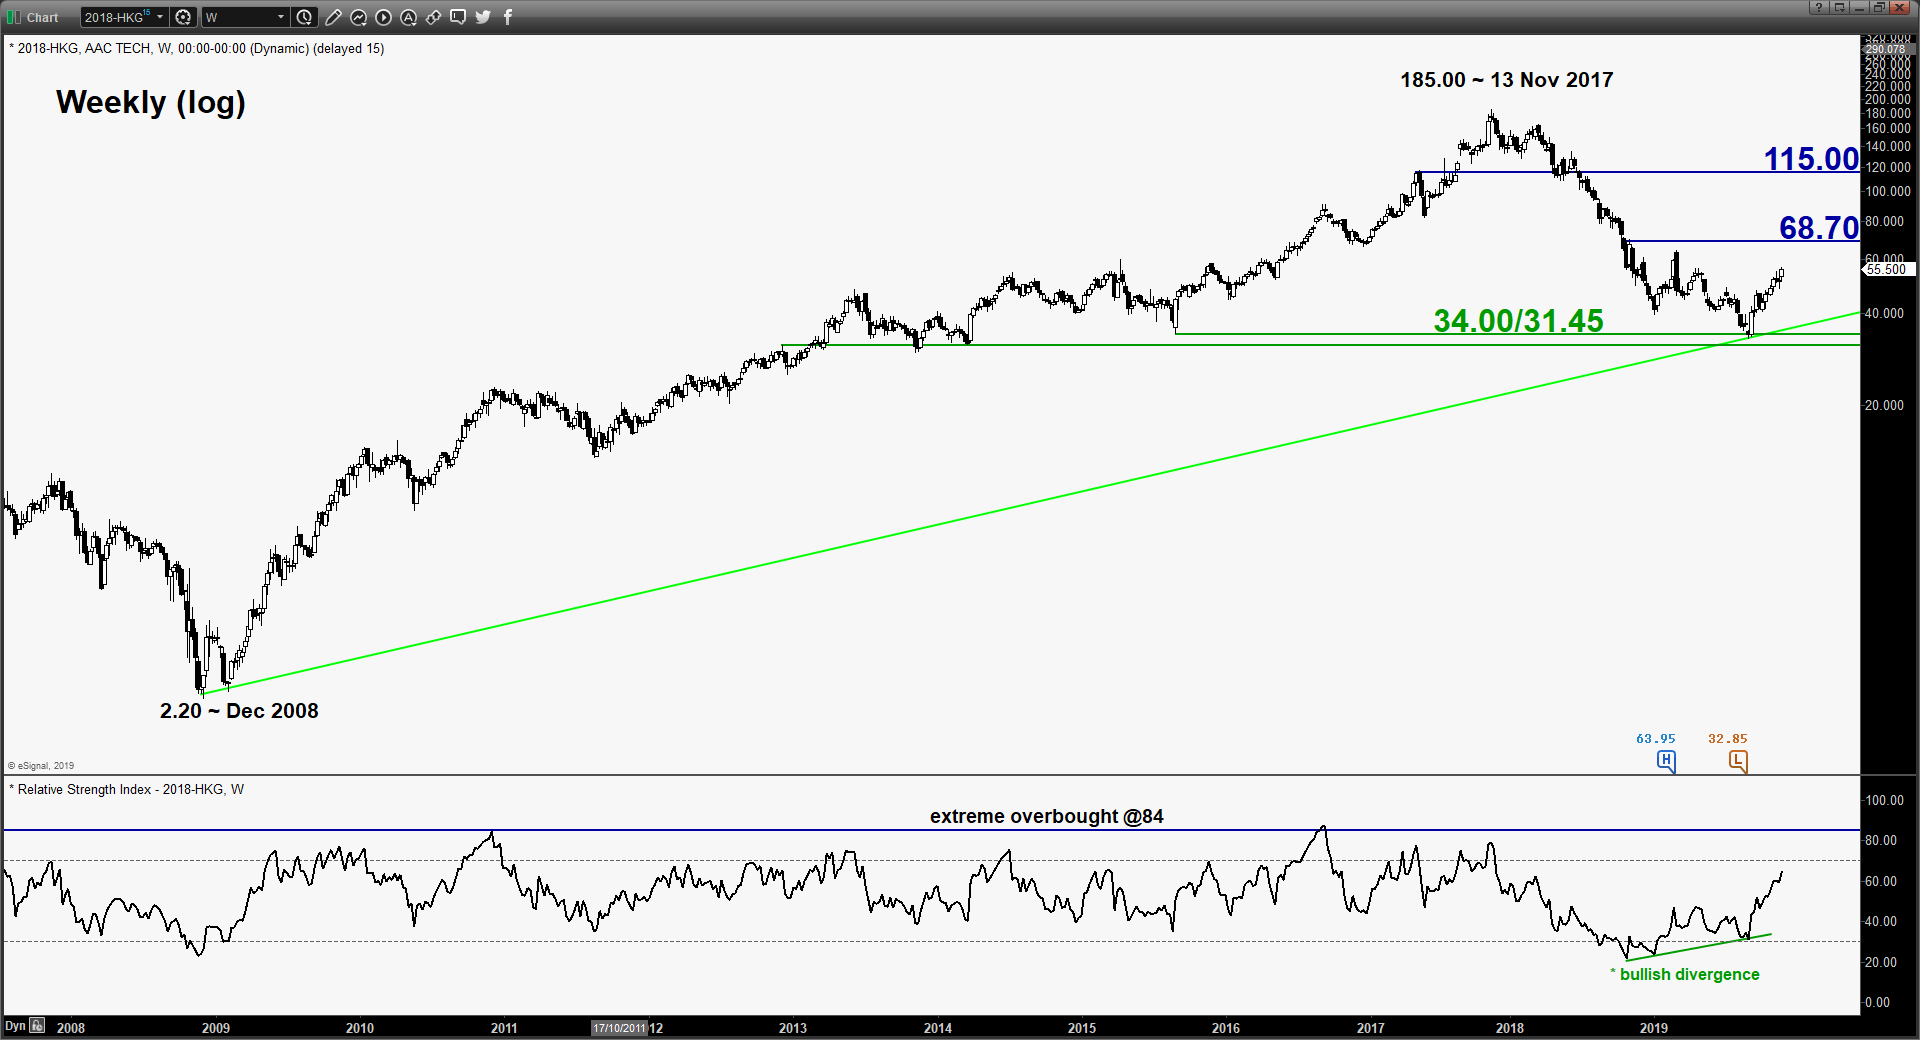
- After a horrendous plunge of 80% from its 185.00 all-time high level printed on 13 Nov 2017, the share price of AAC Tech may have formed a medium-term bottoming configuration. The 9-month of downtrend phase has managed to find support at a long-term secular ascending trendline in place since its Dec 2008 secular low of 2.20 (see weekly chart)
- In addition, the weekly RSI has exited its oversold region with a prior bullish divergence signal and still has further room to manoeuvre to the upside before it reaches an extreme overbought level at 84. These observations suggest a revival of upside momentum.
- Yesterday’s price action has staged a bullish breakout from a 2-year descending trendline resistance from 13 Nov 2017 high (see daily chart) with its pull-back support now at around 53.30. Also, it has been evolving within a medium-term ascending channel in place since 29 Aug 2019 low.
- The up move in price action that is evolving within the ascending channel has been accompanied by an increasing volume and relative strength analysis from its ratio chart suggests outperformance against the market (Hang Seng Index/HSI).
- The next significant medium-term resistance stands at 64.60/68.70 which is defined by the swing highs of 02 Nov 2018/25 Feb 2019, the upper boundary of the medium-term ascending channel and a Fibonacci retracement/expansion cluster.
Charts are from eSignal
Latest market news
Yesterday 10:44 PM
Yesterday 05:00 PM
Yesterday 03:13 PM
Yesterday 01:39 PM
Yesterday 11:05 AM
Latest Tech Stocks articles

October 19, 2023 09:47 AM

October 18, 2023 12:06 PM

October 11, 2023 02:41 PM

October 3, 2023 12:24 PM