
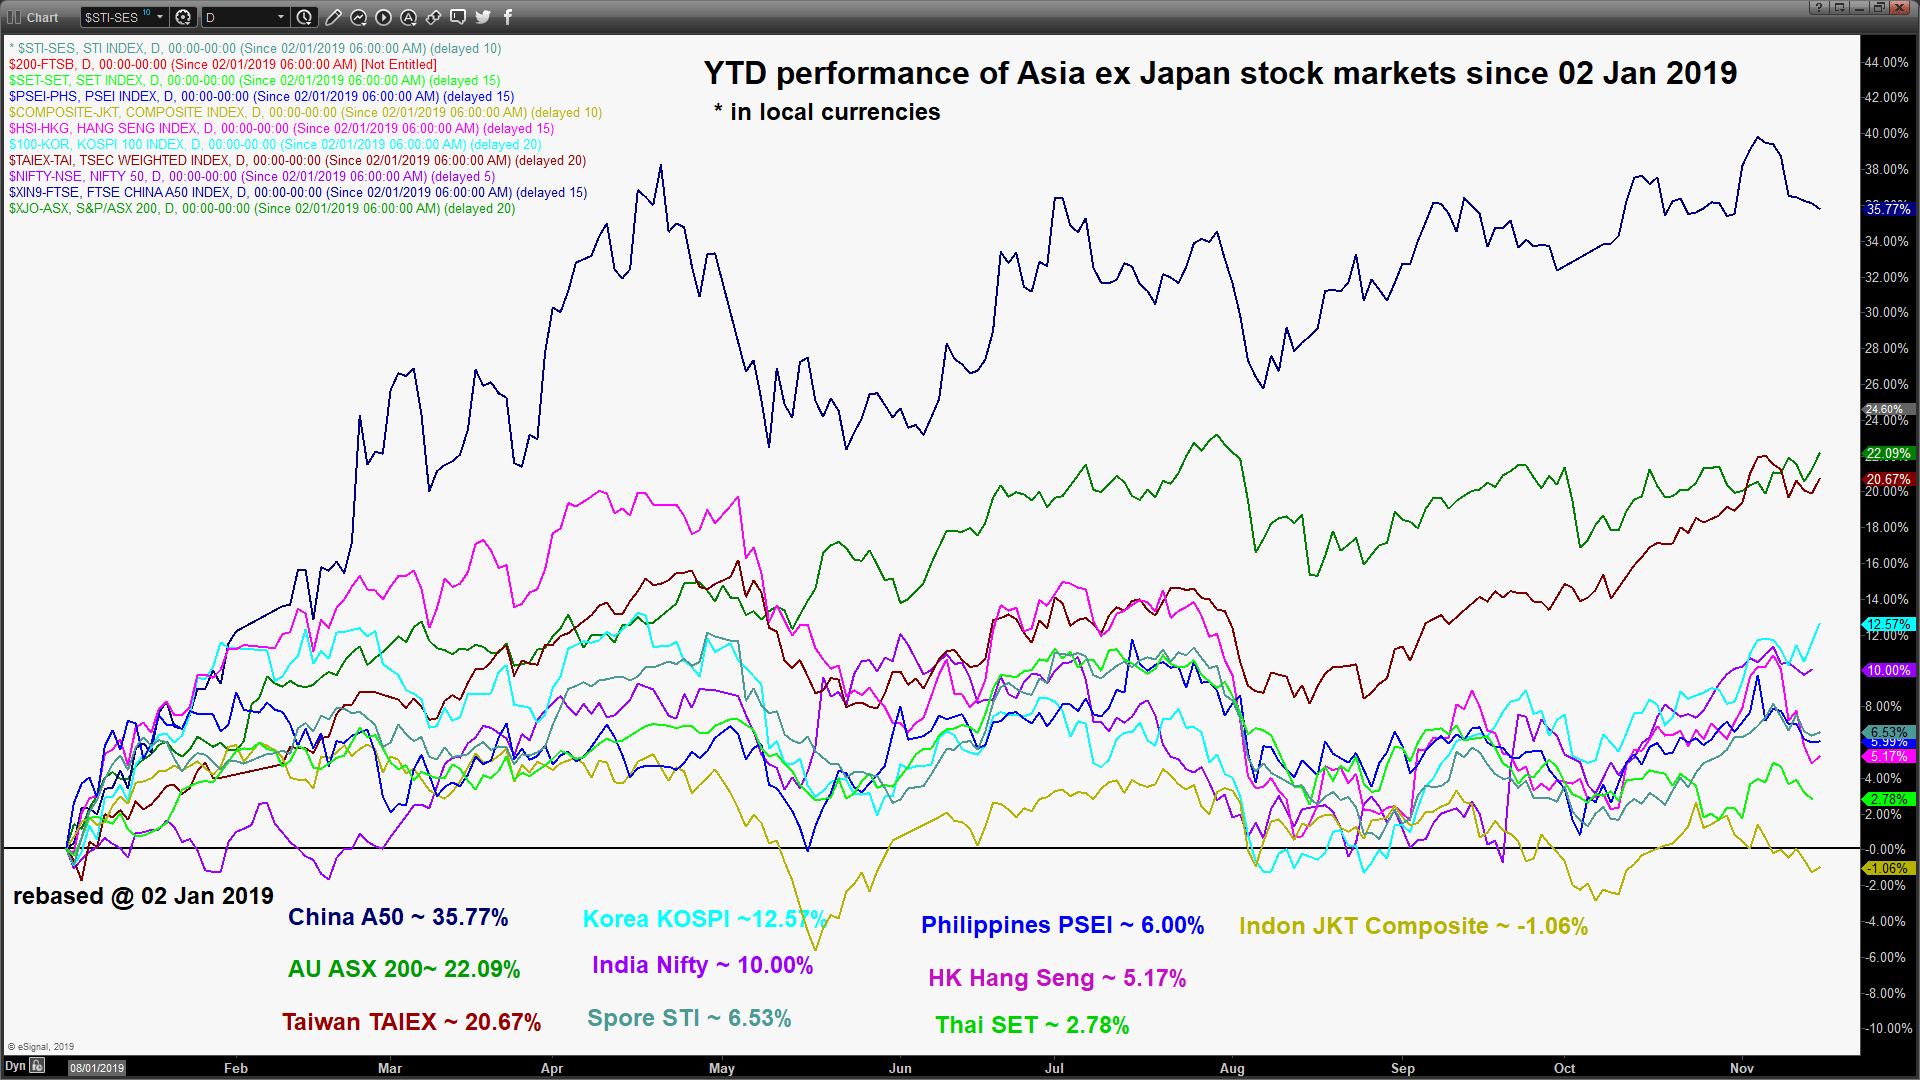
2019 year to performance of Asia ex Japan stock markets till 15 Nov
click to enlarge chart
Medium-term technical outlook on FTSE China A50
click to enlarge charts
Key Levels (1 to 3 weeks)
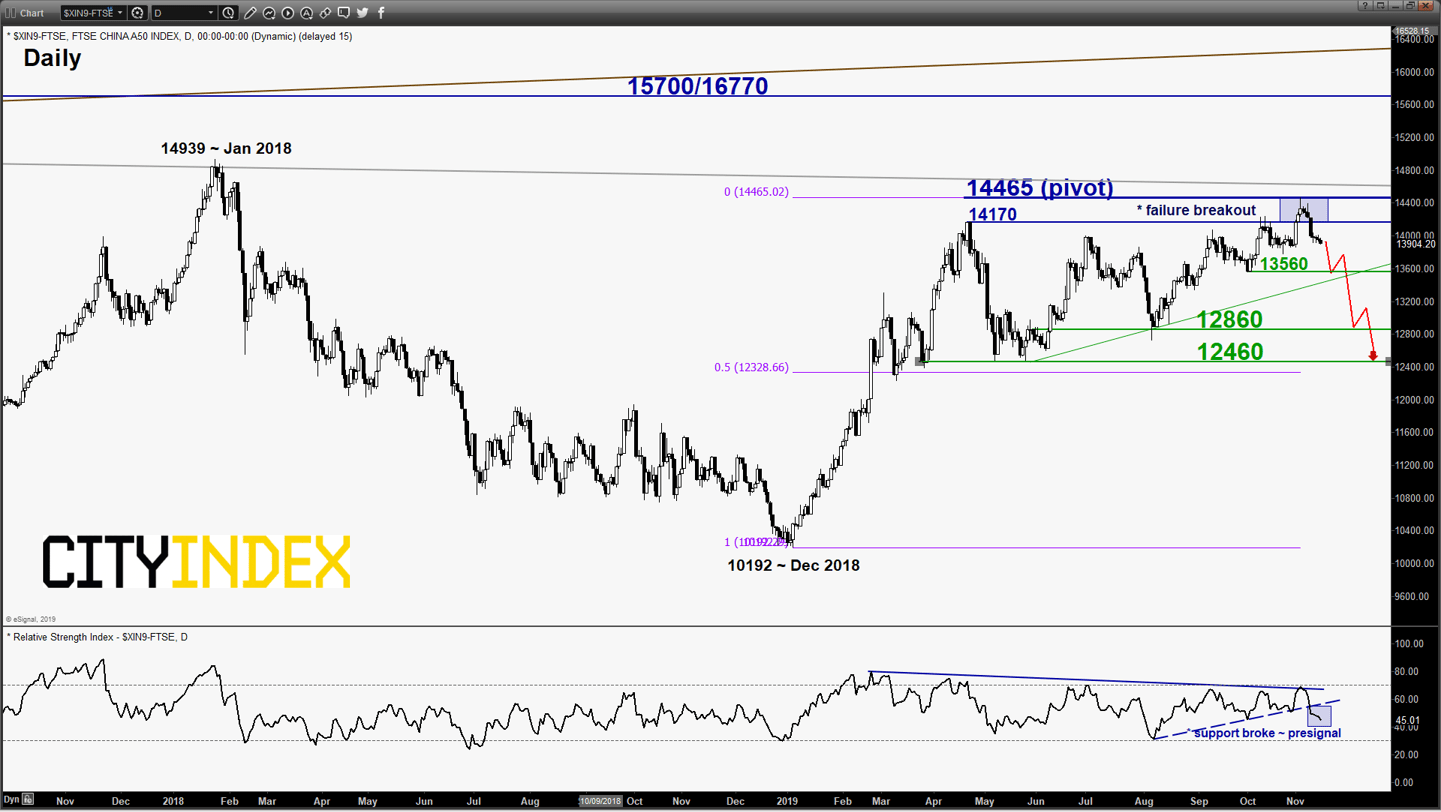
Intermediate resistance: 13560
Pivot (key resistance): 14465
Supports: 13560 (trigger), 12860 & 12460
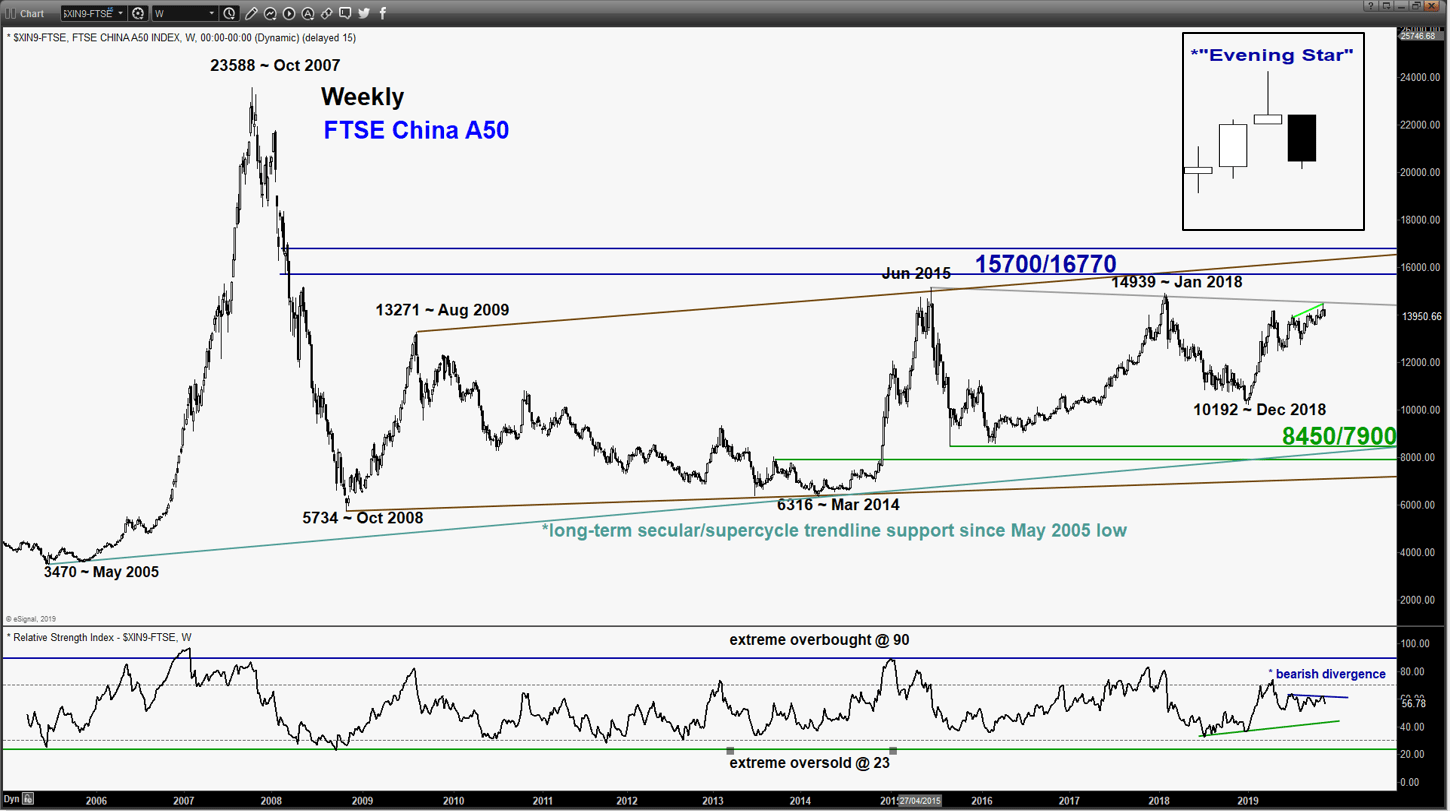
Next resistance: 15700/16770
Directional Bias (1 to 3 weeks)
Bearish bias below 14465 key medium-term pivotal resistance a break below 13560 reinforces a further a potential multi-week corrective decline to target the next supports at 12860 and 12460 within a long-term secular ascending range configuration in place since Oct 2008 low.
On the other hand, a clearance with a daily close above 14465 sees a continuation of major uptrend in place since Dec 2018 to set sight on the secular ascending range resistance at 15700/167700.
Key elements
- The recent 5-month up move of 16% from its 24 May 2019 low has started to stall right below the descending resistance from Jun 2015 major swing high (see weekly chart).
- Price action has also formed an impending weekly “Evening Star” candlestick pattern that tends to indicate a potential bearish reversal in price action after an uptrending phase.
- The weekly RSI oscillator has also shaped a bearish divergence signal since Jul 2019 which indicates the upside momentum has started to wane which increases the risk of a medium-term bearish reversal in price action of the Index.
- The daily RSI oscillator has staged a breakdown from its ascending support which is in parallel with the price action ascending support from 27 May 2019 low. These observations suggest a potential presignal breakdown below the ascending support of 13560.
- The next significant medium-term support rests at 12460 which is defined by the congestion range lows of 25 Mar/23 May 2019 and close to the 50% Fibonacci retracement of the major up move from 04 Jan low to 05 Nov 2019 high.
Charts are from eSignal
Latest market news
Today 05:56 AM
Yesterday 11:57 PM
Yesterday 08:00 PM
Yesterday 02:00 PM
Latest Indices articles

April 25, 2024 03:09 PM

April 25, 2024 03:00 PM
April 24, 2024 03:30 PM

April 18, 2024 04:46 PM