

- ASX 200 futures have broken the bullish uptrend dating back to November 2023
- A similar break in February didn’t stick, resulting in futures ripping to fresh record highs
- The two largest sectors in the index – financials and materials – look vulnerable to downside on fundamental grounds
- Wait for confirmation of a clean break before considering shorts
Friday looms as an important day on the directional risks for Australia’s ASX 200 with futures puncturing through uptrend support overnight dating back to when the Fed pivoted away from rate hikes in early November. Recent history suggests it may pay to wait to see whether the break sticks.
ASX 200 futures uptrend under threat
Here’s the daily chart of SPI futures, showing not only has the price broken through its medium-term uptrend but also RSI. MACD has also crossed over from above, indicating a shift in momentum to the downside. Combined with the bearish outside day candle printed on Monday, the ducks are lining for the start of a new trend.
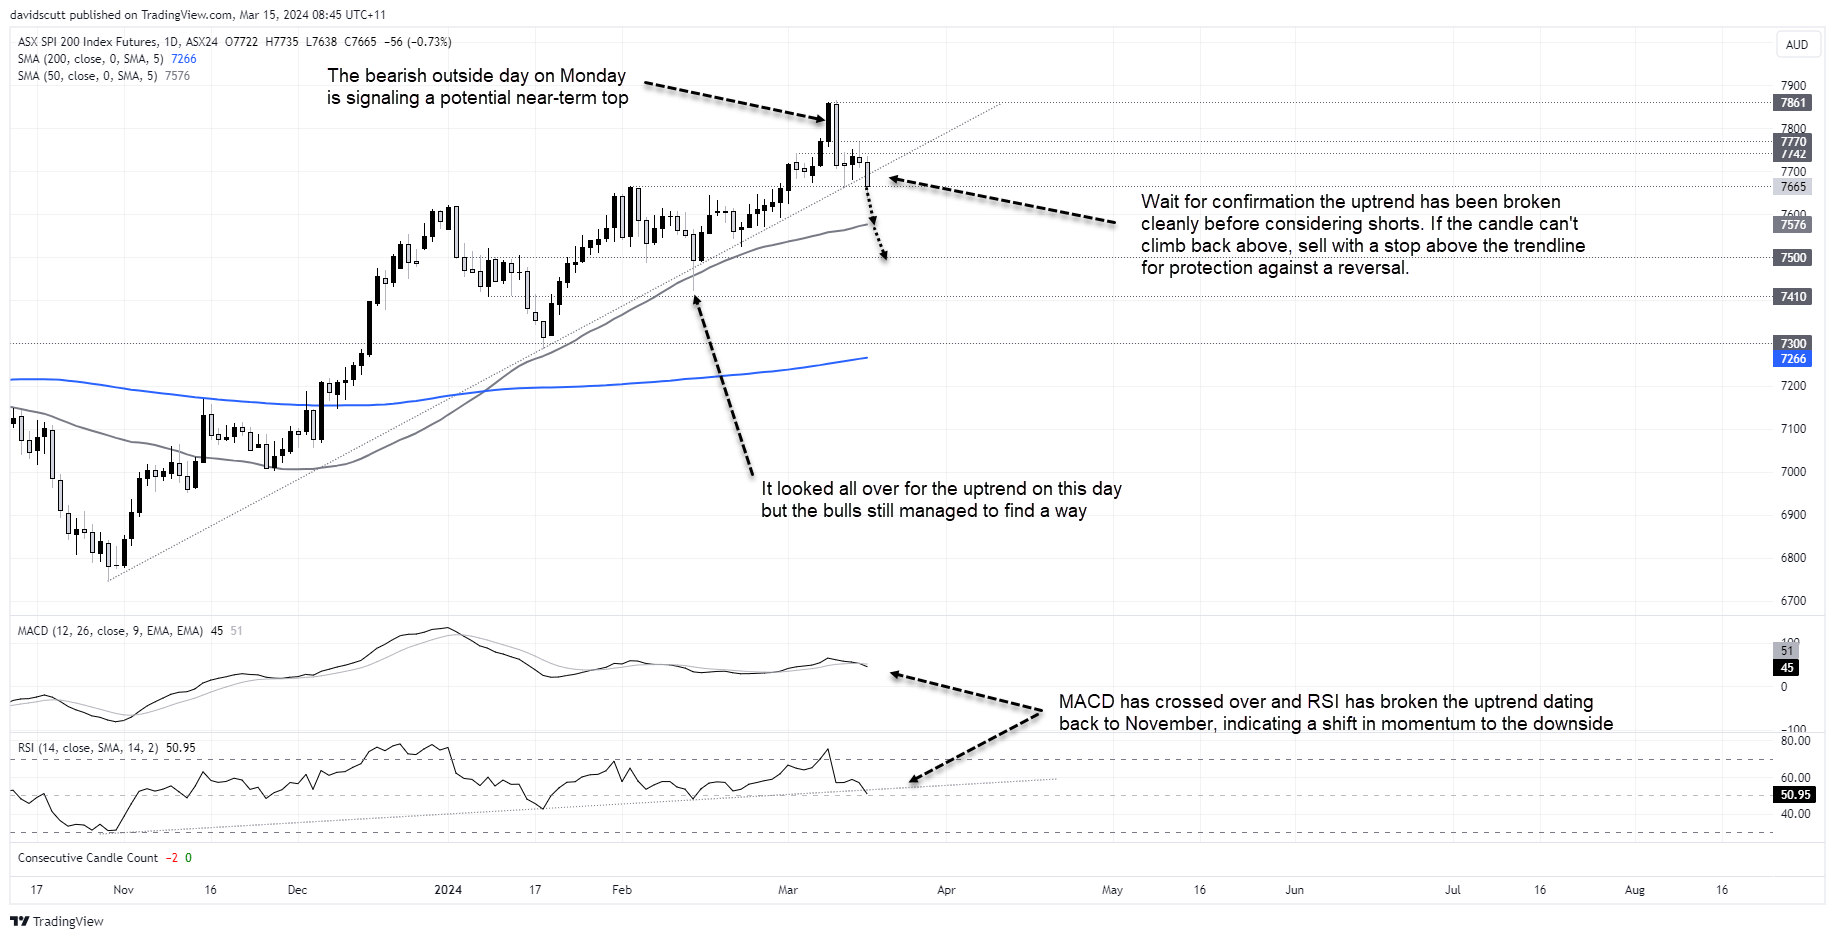
From a fundamental perspective, with bank valuations nearing extreme levels and iron ore and coal prices falling through the fall, more than half of the entire ASX 200 screens as vulnerable to downside.
But before you get too bearish…
But SPI has confounded the bears on numerous occasions over the past few months.
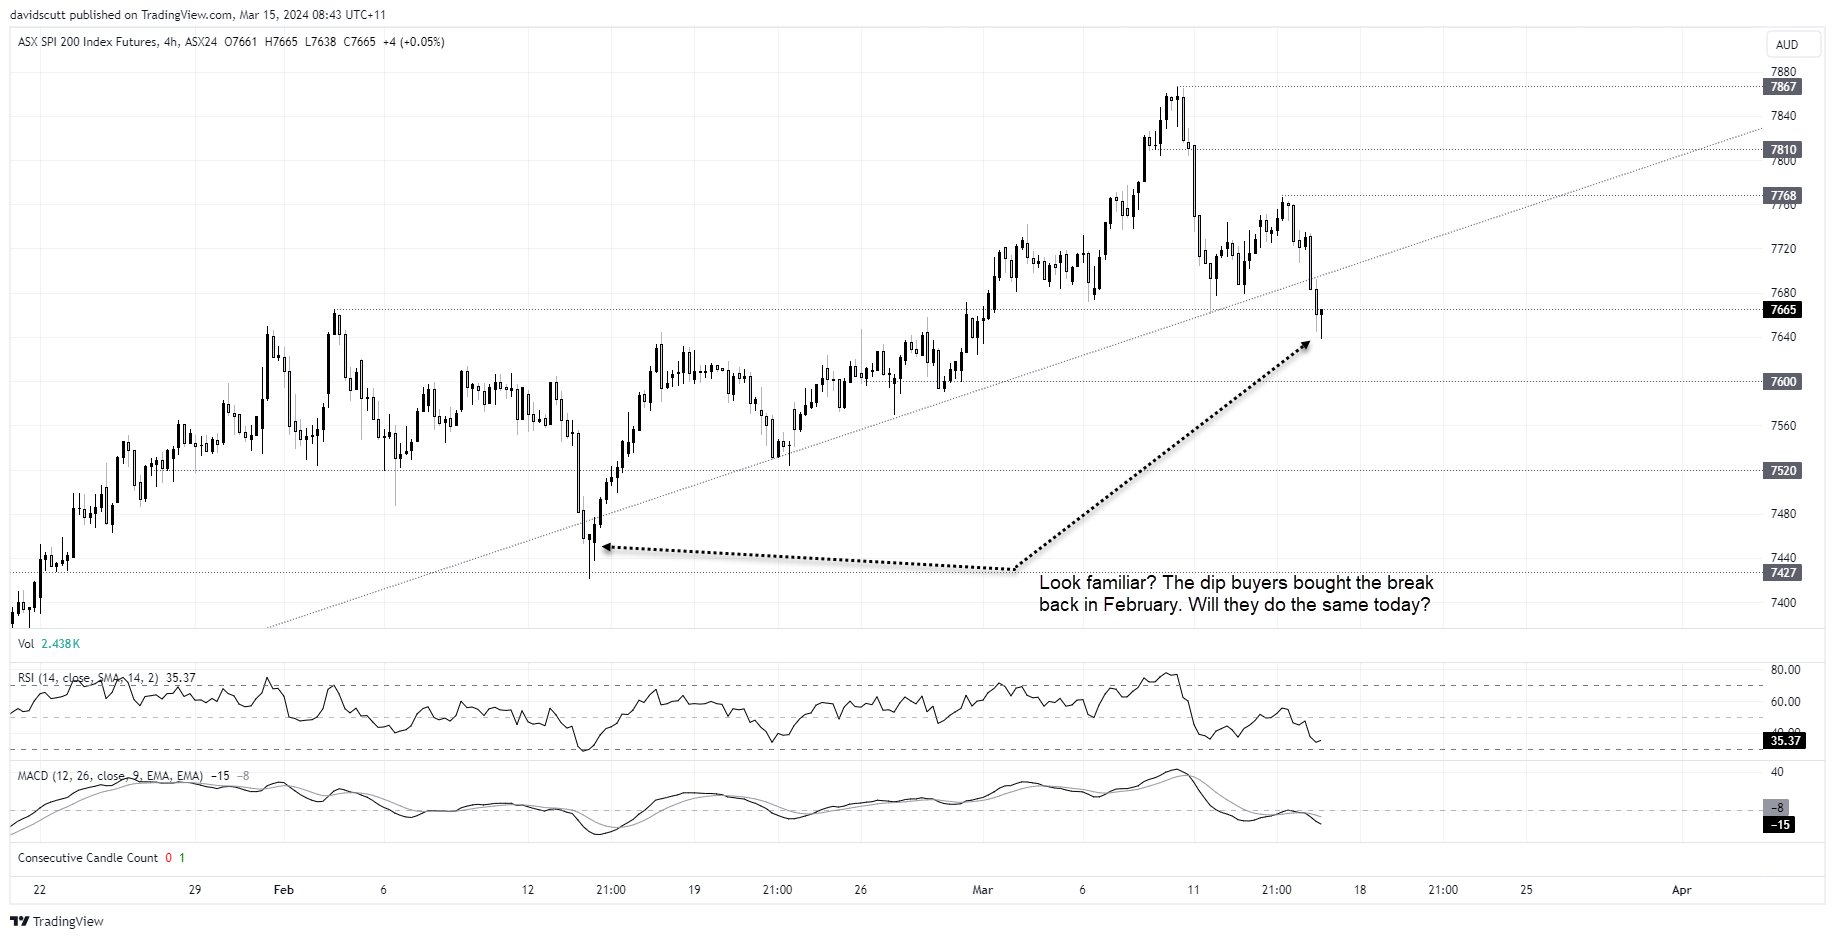
I want to draw your attention to the candle indicated on the chart back in mid-February after the hot US CPI report for January was released. It looked all over for the uptrend on that day yet buyers managed to arrest the situation, slamming futures back above support.
That’s why I want to see the move stick before getting short.
Adding to the caution, when you zoom in looking at the four hourly chart below, the last candle – a big bullish hammer – signals the dip-buyers are already circling.
ASX 200 trade idea
I’m waiting to see whether the break on the daily chart sticks before considering going short. If we get confirmation that’s the case, you can sell below the trendline with a stop above for protection. The initial target would be the 50dma at 7576, a level SPI has respected on numerous occasions when tested over the past year. Below, 7500 saw a lot of work either side in January and February, so that looms as the potential end target.
Should SPI manage to climb back through the trendline, that will yet again change the picture. Big session coming up!

-- Written by David Scutt
Follow David on Twitter @scutty
How to trade with City Index
You can trade with City Index by following these four easy steps:
-
Open an account, or log in if you’re already a customer
• Open an account in the UK
• Open an account in Australia
• Open an account in Singapore
- Search for the market you want to trade in our award-winning platform
- Choose your position and size, and your stop and limit levels
- Place the trade
Latest market news
Yesterday 01:32 PM
Yesterday 09:35 AM
Yesterday 07:23 AM
Yesterday 04:48 AM
Yesterday 12:17 AM
July 25, 2024 10:39 PM
Latest Equities articles


June 8, 2024 02:00 AM

June 3, 2024 05:56 AM

June 3, 2024 03:34 AM