Big data dump from UK ahead
Last week, the BOE took a less dovish stance on monetary policy as they communicated that although they told banks to prepare for negative rates, they didn’t mean to imply that they were going to move rates below 0%. On Friday, the country will release its first look at Q4 2020 GDP. Expectations are for a meager 0.5% vs 16% growth in Q3. However, recall that they country was in lockdown for most of December and was waiting on a Brexit trade deal. In addition, the UK will release data for December Trade Balance, Industrial Production and Manufacturing Production. Although these are backward looking numbers, they may give us a clue as to what the BOE was thinking when they first mentioned negative rates in the fall. If the data is worse than expected, and with the UK in lockdown through at least early March, perhaps we will end up seeing negative rates at some point.
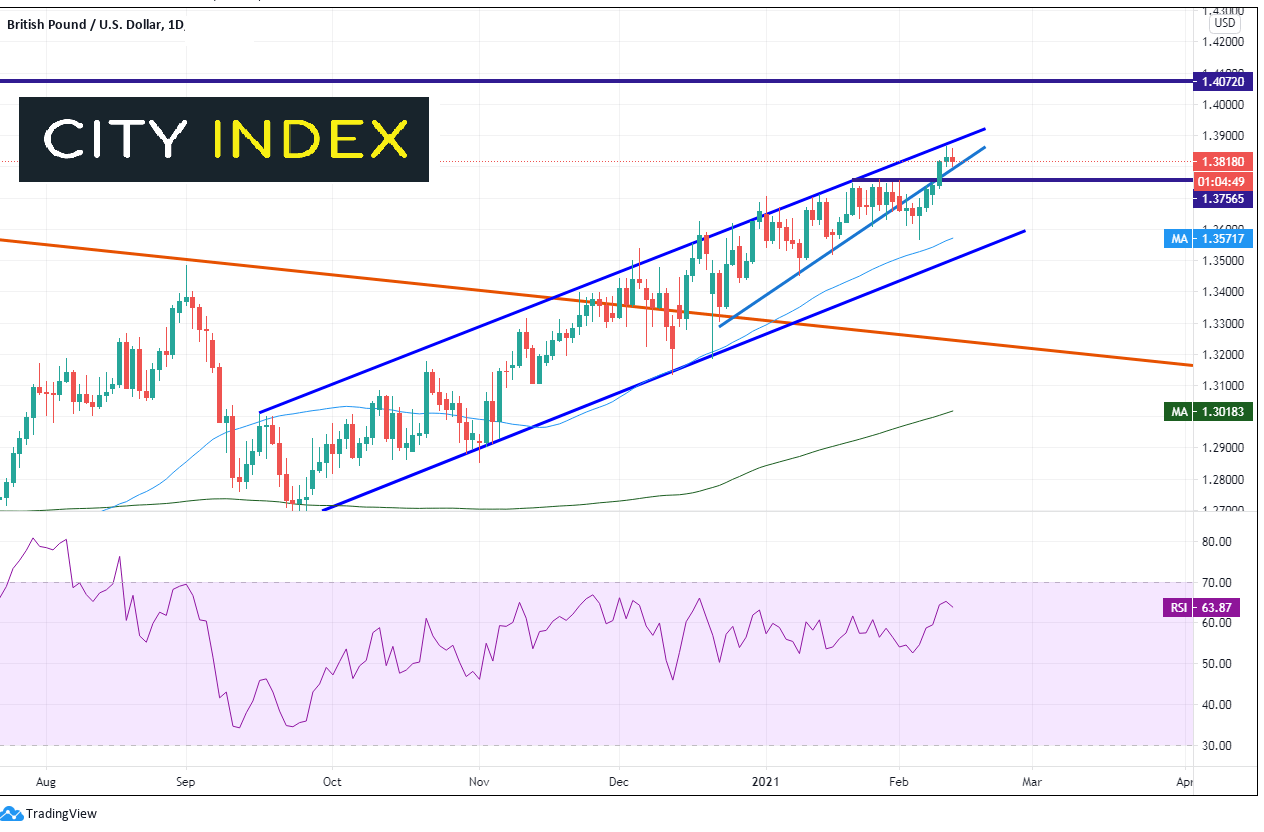
GBP/USD has been in an orderly upward sloping channel since mid-September 2020. Within that channel, price began forming an ascending wedge, and briefly traded below in early in February. However, after the BOE meeting on February 4th, bulls were right back at it and brought the pair from a low of 1.3566 to highs not seen since April 2018, then the top trendline (of both the channel and the wedge, near 1.3866. GBP/USD put in tweezer tops Wednesday and Thursday, indicating sellers were waiting near the trendline above. If price moves above Wednesday’s highs, the next resistance level isn’t until the psychological round number of 1.4000. Above there price can move to horizontal resistance from 2018, near 1.4072. First support is at previous highs near 1.3758, then at the low of February 4th (BOE day) at 1.3566. This level confluences with the 50 Day Moving Average. The bottom trendline of the rising channel is near 1.3500.

Source: Tradingview, City Index
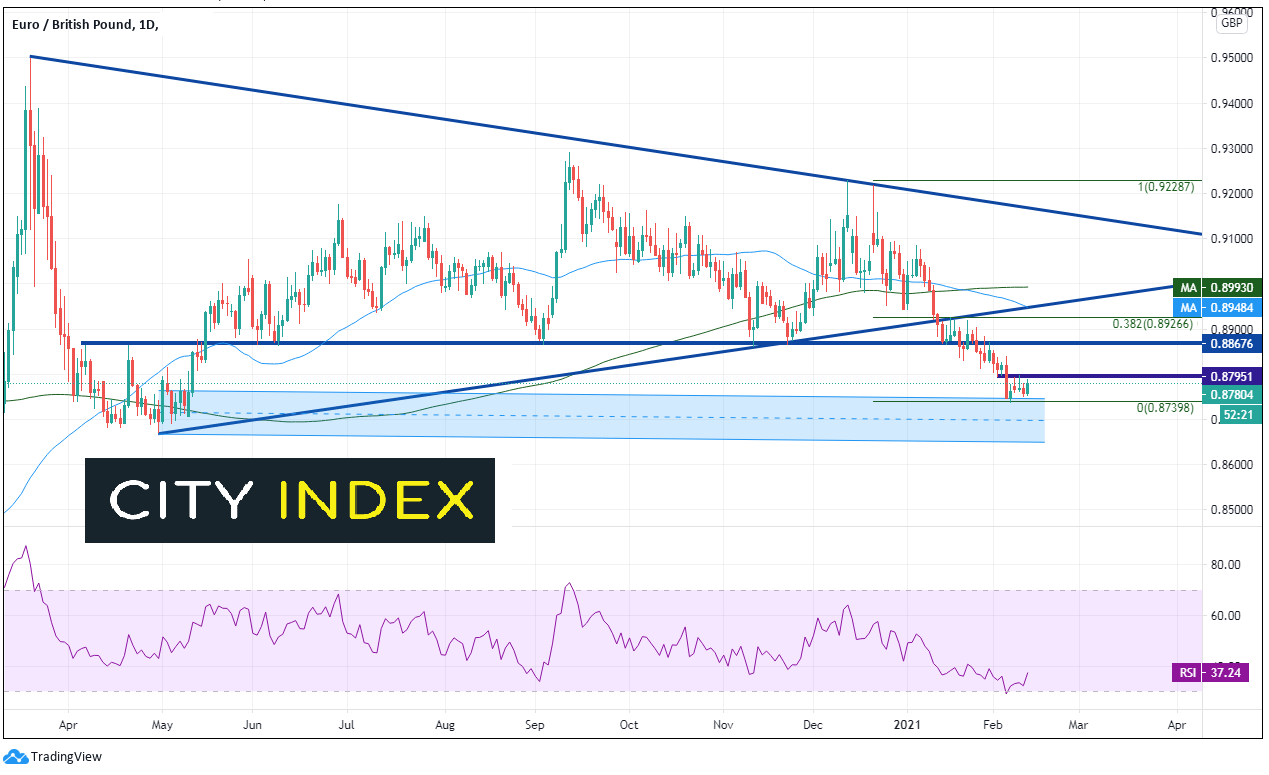
EUR/GBP traded lower over of a symmetrical triangle of January 12th and accelerated lowed after the BOE meeting, testing a band of support from May 2020 near 0.8750. The pair is currently trading just above there, as the RSI unwinds from oversold territory. The ECB has already signaled they are extremely dovish, and may be willing to cut rates again, even lower than -0.5%. However, if the Q4 data is worse than expected, there may be reason for the pair to bounce. First horizontal resistance is at 0.8795. Horizontal resistance above there is at 0.8868, and then the 38.2% Fibonacci retracement level from the December 20th. 2020 highs to the February 5th lows, near 0.8927. Support is at February 5ths lows at 0.8738, ahead of a band of support all the way down to 0.8671.

Source: Tradingview, City Index
Q4 2020 GDP and a host of other data to be released on Friday may give us a clue as to what the BOE was thinking when they mentioned negative rates in the fall. In addition, with the country still in lockdown until March, this may give us a peak behind the curtain of what lies ahead for Q1.
Learn more about forex trading opportunities.


