


US Dollar Outlook: USD/JPY
USD/JPY appears to be negating a bull-flag formation as it tumbles to a fresh weekly low (146.07), but the Federal Reserve interest rate decision may sway the near-term outlook for the exchange rate should the central bank tame speculation for a rate cut in March.
US Dollar Forecast: USD/JPY Bull Flag Under Threat with Fed on Tap
USD/JPY fails to hold within last week’s range as long-term US Treasury yields come under pressure, and the exchange rate continue to give back the advance from the start of the month as the Federal Open Market Committee (FOMC) is expected to retain the current policy.
Join David Song for the Weekly Fundamental Market Outlook webinar. David provides a market overview and takes questions in real-time. Register Here
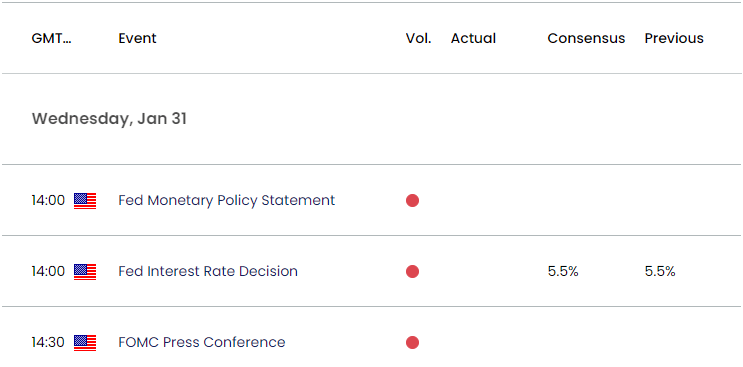
US Economic Calendar
The FOMC rate decision may produce headwinds for the Greenback as Fed officials ‘viewed the policy rate as likely at or near its peak for this tightening cycle,’ and the central bank may prepare US households and businesses for a less restrictive policy amid ‘growing signs of demand and supply coming into better balance.’
CME FedWatch Tool
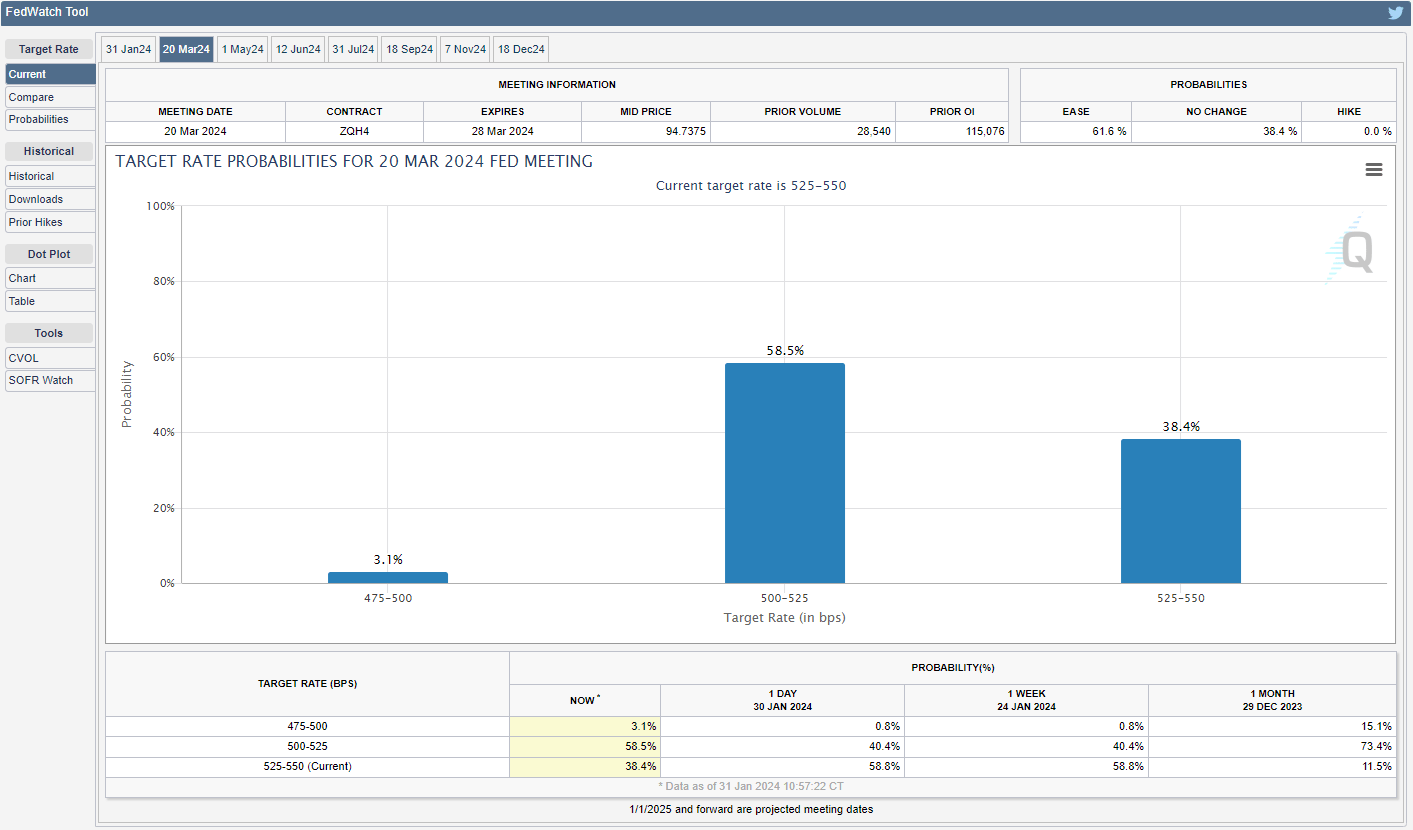
Source: CME
As a result, a further adjust in the Fed’s forward guidance for monetary policy may undermine the bull flag formation in USD/JPY, and the CME FedWatch Tool may show growing speculation for a change in regime as it currently reflects greater than 60% chance for a rate cut in March.
However, the Fed rate decision may generate a bullish reaction in the Greenback should Chairman Jerome Powell and Co. show a greater willingness to keep US interest rates higher for longer, and a hawkish forward guidance may also influence carry trade interest as the Bank of Japan (BoJ) sticks to Quantitative and Qualitative Monetary Easing (QQE) with Yield Curve Control (YCC).
With that said, USD/JPY may attempt to extend the advance from the start of the month if the bull flag formation unfolds following the Fed rate decision, but the advance from the January low (140.82) may continue to unravel if the exchange rate negates the continuation pattern.
USD/JPY Price Chart – Daily
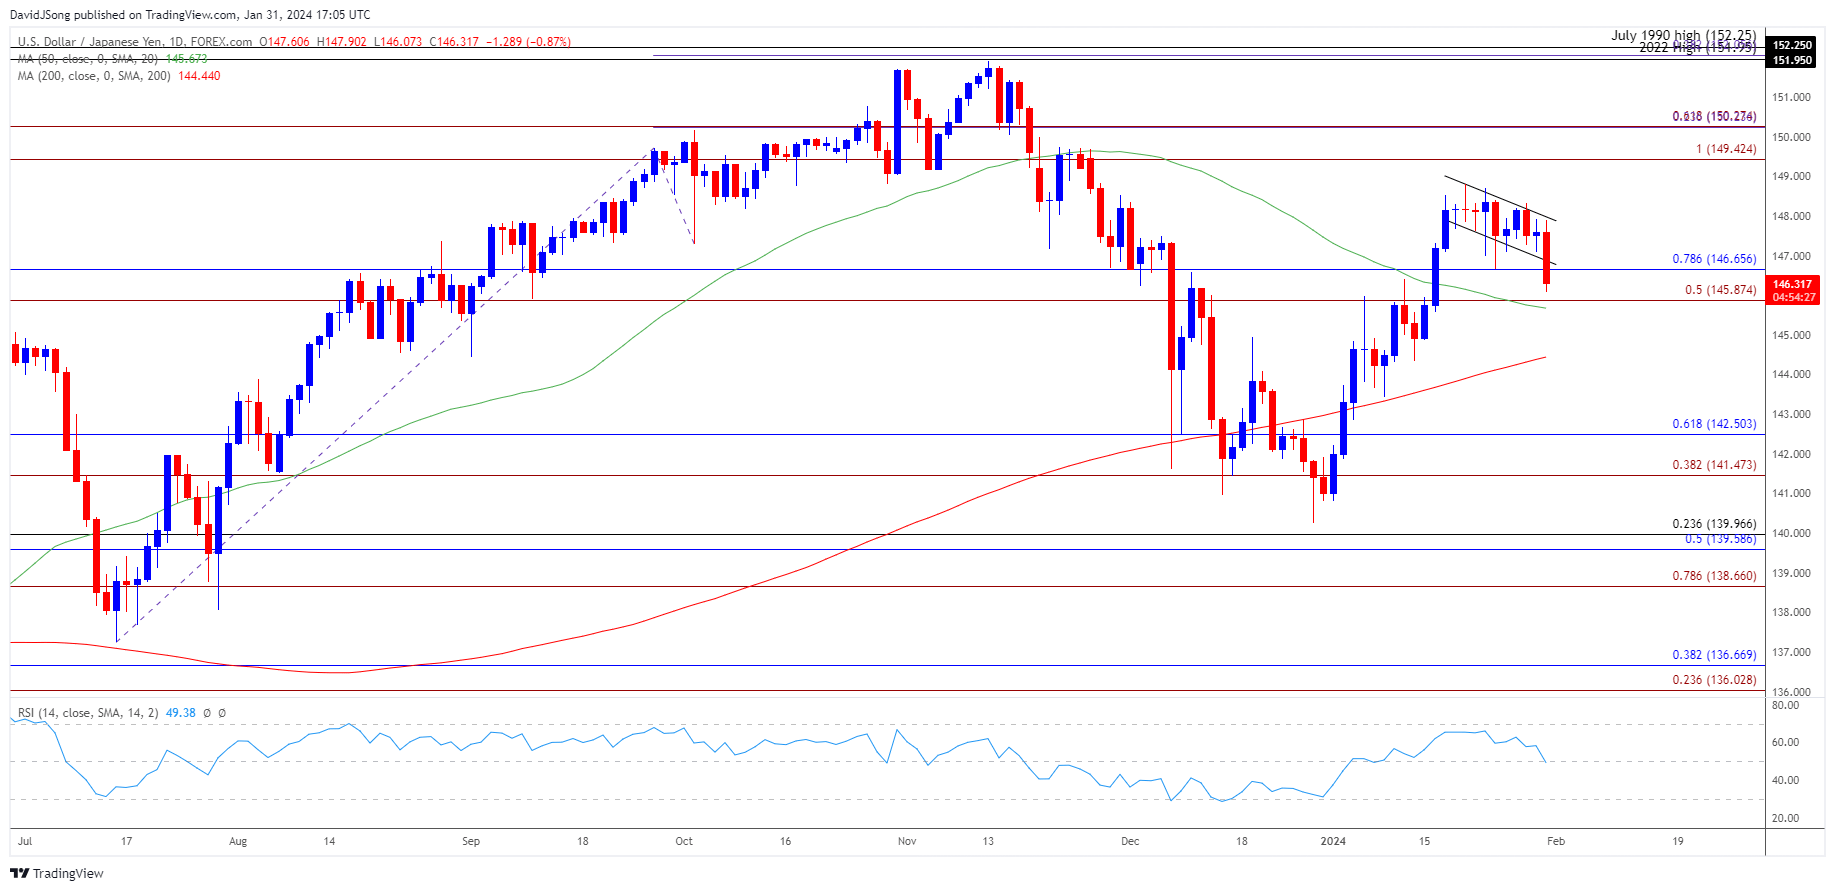
Chart Prepared by David Song, Strategist; USD/JPY on TradingView
- USD/JPY seems to be trading within a bull flag formation following the failed attempt to test the monthly high (148.81), and the continuation pattern may unfold over the coming days as long as the exchange rate holds above the 50-Day SMA (145.67).
- A breach above the monthly high (148.81) brings the 149.40 (100% Fibonacci extension) to 150.30 (61.8% Fibonacci extension) region on the radar, with the next area of interest coming in around the 2023 high (151.91).
- However, USD/JPY may negate the continuation pattern it if fails to hold above the moving average, with a break/close below the 145.90 (50% Fibonacci extension) to 146.70 (78.6% Fibonacci retracement) area opening up the 141.50 (38.2% Fibonacci extension) to 142.50 (61.8% Fibonacci retracement) region.
Additional Market Outlooks:
US Dollar Forecast: AUD/USD Struggles to Trade Back Above 50-Day SMA
US Dollar Forecast: USD/CAD Fails to Test Monthly High Ahead of Fed
--- Written by David Song, Strategist
Follow on Twitter at @DavidJSong
Latest market news
Today 05:56 AM
Yesterday 11:57 PM
Yesterday 08:00 PM
Yesterday 02:00 PM
Latest USD JPY articles

Today 05:56 AM

April 26, 2024 11:40 AM
April 24, 2024 03:14 PM