


- Chinese equities have been the market left behind in the global rally this year
- Reports of state-backed buying helped China’s A50 bounce off a key level on Monday
- The US S&P 500 broke to fresh YTD highs ahead of key inflation data, suggesting only hot underlying reading may be enough to derail the rally
Equities worldwide are in beast-mode, putting in higher highs after higher highs, in some instances to record territory. But there is one exception to the rule: China. In contrast to price action on the S&P 500 which is within touching distance of record highs, China’s A50 is languishing at multi-year lows, hit by a sluggish domestic economy, fears about negative spillover effects from distressed property developers, along with geopolitical and regulatory risks which have exacerbated foreign capital outflows.
Given how synchronised equity markets have been over the cycle in other parts of the world, it comes as no surprise that Chinese markets are on the nose. Too hard basket, many would say. Some may even argue that given the risks, China is uninvestable. But when evaluating risk versus reward, everything has a price. Eventually.
Perhaps we’re nearing that point?
‘National Team’ reportedly sparks big A50 bounce
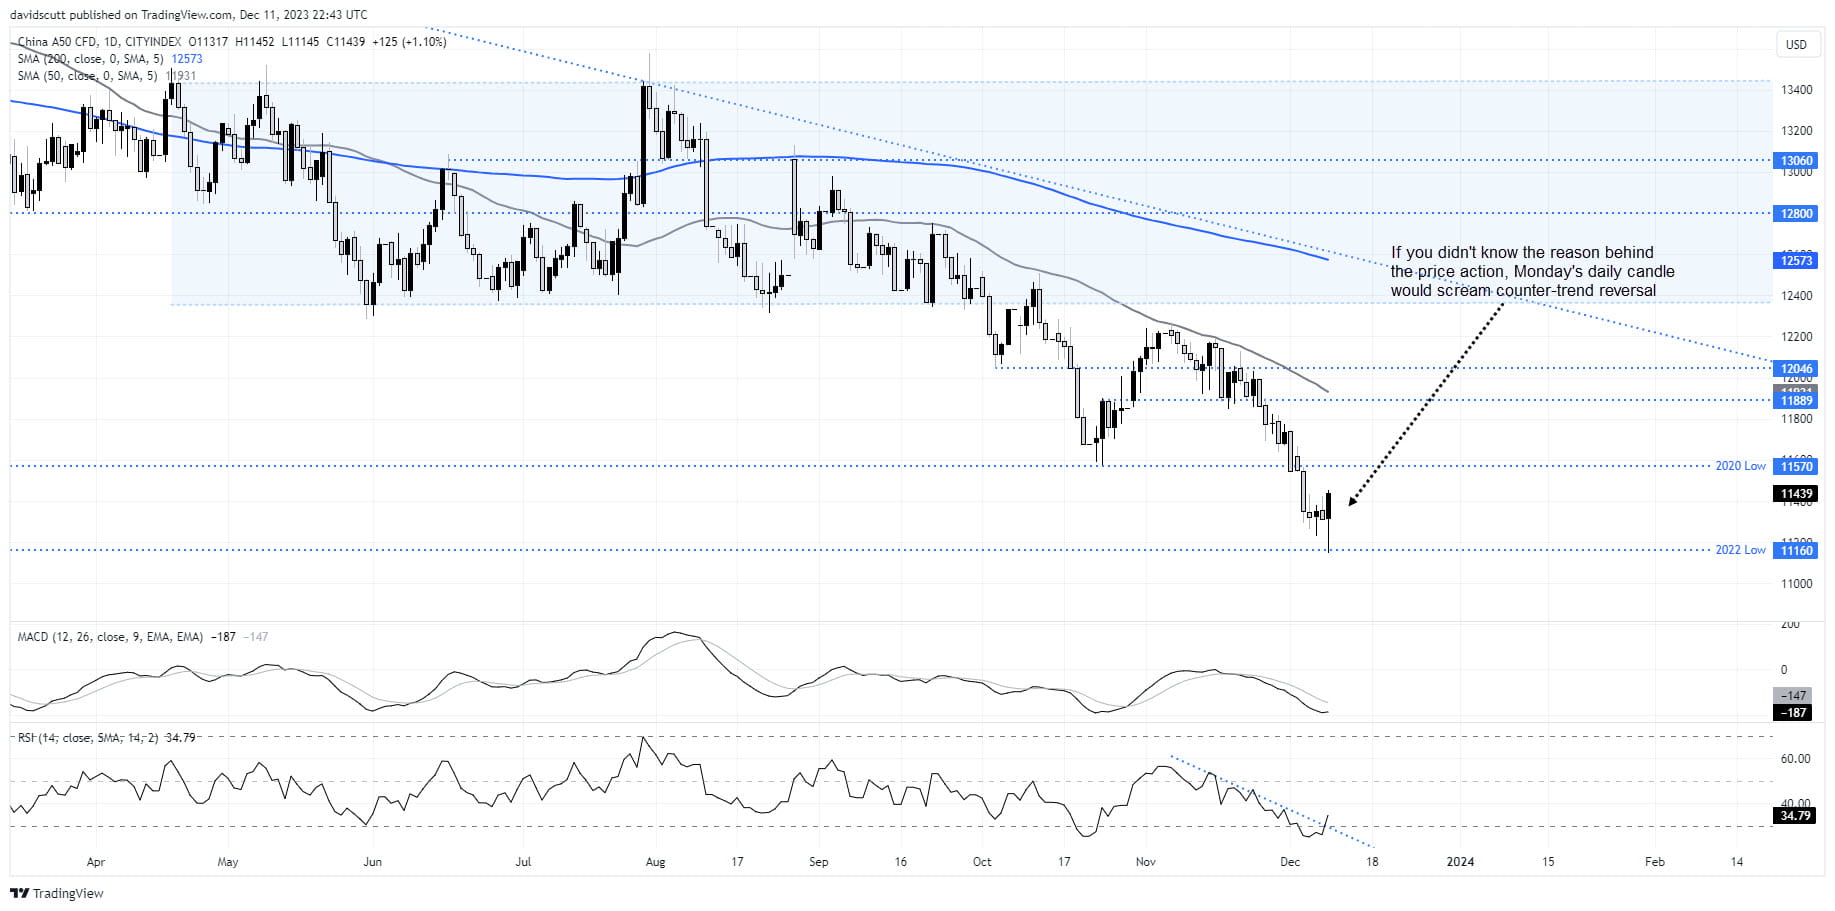
While it comes with the full disclaimer the rebound likely reflects buying from one or multiple Chinese state-backed institutions referred to outside of China as the ‘National Team’, the price action on the A50 Index on Monday was arguably the most bullish thing mainland equity investors have seen in 2023. Looking at the daily chart, there’s not much else to choose from.
But having tagged the low struck during the worst of lockdown pessimism last year, the bounce over the second half of the session was truly spectacular, seeing the index manage to close above the intraday highs seen in prior three sessions. While not quite a bullish engulfing candle, taken in isolation, the price action was just as bullish, pointing to the potential for a more meaningful rebound. Yes, it was probably forced, and there is major Chinese economic data out this week in the form of industrial production, property investment and retail sales that could add to elevated levels of pessimism, but it's the type of move that may mark a near-term bottom.
For those considering a countertrend long, entry around these levels, with a stop below 11160, could target a move back towards the 50-day moving average and horizontal resistance just below 11900. If the trade were to be successful, a decision could be made to either hold or cut once the target has been achieved.
S&P 500 traders show no fear of CPI or Fed
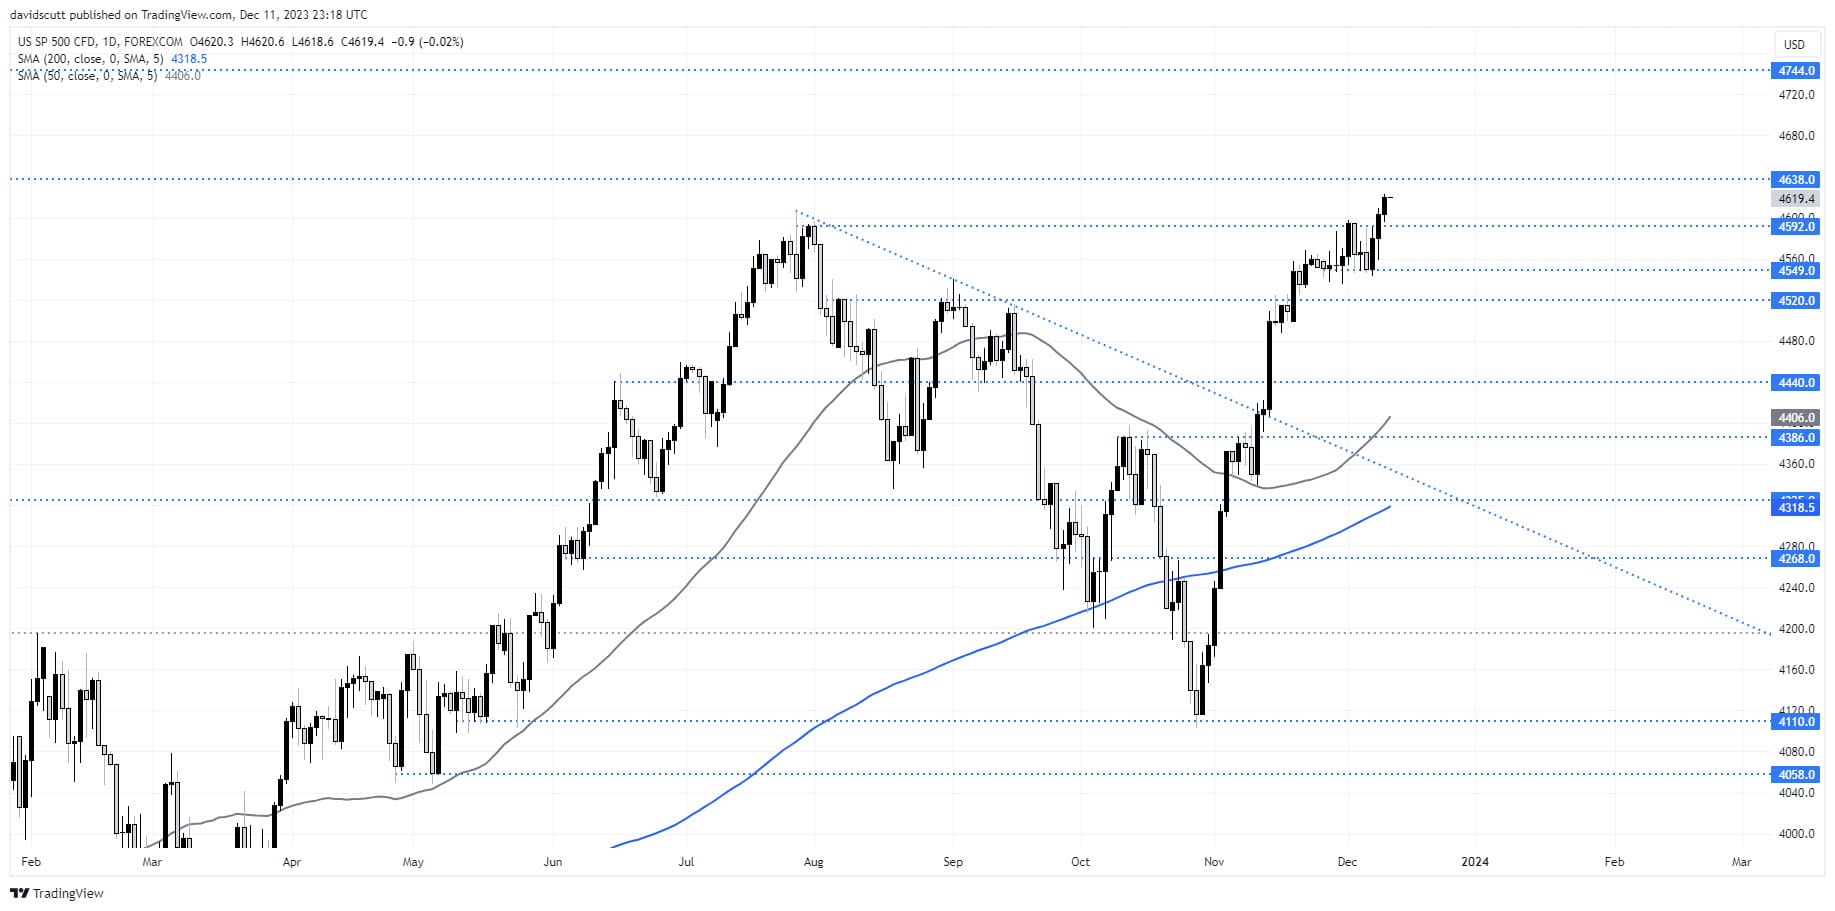
As mentioned above, relative to the price performance from the largest Chinese listed companies, those in the United States have been flying since the end of October, helping the S&P 500 jump to the highest level of the year. Having managed to crack and close above 4592 on Friday, the index went on with the move to start the trading week, showing little concern about a series of significant risk events that arrive in the coming days.
While the Federal Reserve December FOMC interest rate decision is naturally getting plenty of attention given it has updated economic and interest rate projections along with the statement and press conference, Tuesday’s US consumer price inflation report (CPI) may set the tone for the remainder of the week.
Given the willingness of traders to push the index to fresh year-to-date highs heading into the event, you get the sense only an uncomfortably strong core CPI reading will be enough to dent confidence the Fed will follow through with the more than 100 basis points of rate cuts expected in 2024.
If the disinflationary trend remains intact, markets may choose to look through any attempt from the Fed to push back against current pricing. Core inflation is expected to have increased 0.3% in November, leaving the annual rate steady from a month earlier at 4%. While not the Fed’s preferred inflation gauge, the latter would still be double its 2% target.
On the topside, minor resistance is located at 4638 and again around 4744. Above that, the next stop would be record highs. As for nearby downside support, 4592, 4549 and 4520 are the levels to watch. Unless the inflation data starts heating up or activity data begin to roll over rapidly – unlikely in the near-term – the path of least resistance remains to the upside.
-- Written by David Scutt
Follow David on Twitter @scutty
How to trade with City Index
You can trade with City Index by following these four easy steps:
-
Open an account, or log in if you’re already a customer
• Open an account in the UK
• Open an account in Australia
• Open an account in Singapore
- Search for the market you want to trade in our award-winning platform
- Choose your position and size, and your stop and limit levels
- Place the trade
Latest market news
Yesterday 01:32 PM
Yesterday 09:35 AM
Yesterday 07:23 AM
Yesterday 04:48 AM
Yesterday 12:17 AM
July 25, 2024 10:39 PM
Latest Equities articles


June 8, 2024 02:00 AM

June 3, 2024 05:56 AM

June 3, 2024 03:34 AM