


February 23, 2022 2:13 AM

The key U.S. stock market, the S&P500, is trading 5% below its February 10 highs. However, in the FX space, the AUDUSD, traditionally viewed as a “risky” currency correlated to stock market movement, is trading at .7235, less than -0.5% below its February 10 high.
The breakdown in the correlation between the S&P500 and the AUDUSD is viewed on the chart below and prompts the question what is behind the breakdown?
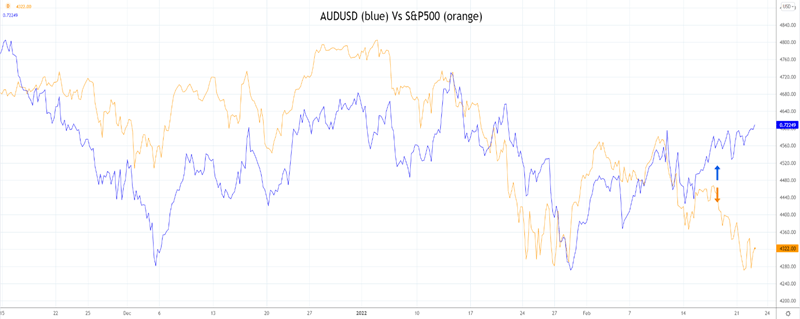
The first is that the AUDUSD is currently supported by dividend repatriation flows for shareholders of the three big Australian mining companies. It is estimated about US$8bn will need to be converted into Australian dollars ahead of the dividend payment dates of BHP, FMG and Rio in late March/Mid-April.
President Biden this morning announced a range of sanctions on Russia. While the sanctions are unlikely to deter Putin’s future expansionary plans, prices of essential commodities including palladium, nickel, natural gas, oil uranium, grains and fertilisers are likely to be supported, aggravating the current energy and commodity crisis.
Higher commodity and energy prices are supportive of the Energy and Materials sectors in the ASX200 and, by extension, the AUDUSD, as noted in the first point above.
The release of weaker than expected 4Q Wage Price Index today left the annual rate of wages growth at a modest 2.3%, forcing a reassessment of the market's aggressive rate hike expectations. It has also been brushed off by the AUDUSD.
Technically the AUDUSD has broken and closed above the trendline resistance viewed on the chart below at .7220. Based on the factors outlined above, look for the AUDUSD to continue to grind higher towards the next layer of resistance at .7315. And then the 200-day moving average of .7340. The bullish bias would be negated if the AUDUSD were to break below recent lows at .7165.
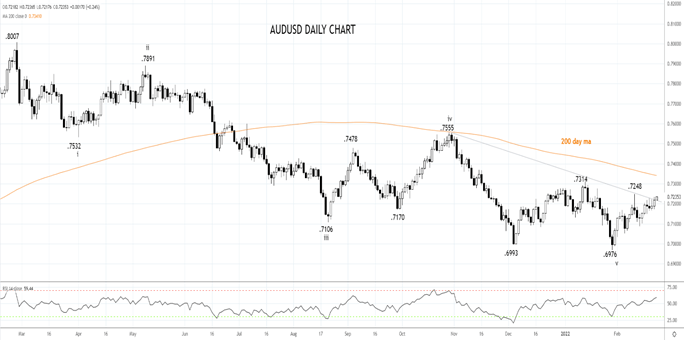
Source Tradingview. The figures stated areas of February 23, 2022. Past performance is not a reliable indicator of future performance. This report does not contain and is not to be taken as containing any financial product advice or financial product recommendation
How to trade with City Index
You can trade with City Index by following these four easy steps:
-
Open an account, or log in if you’re already a customer
• Open an account in the UK
• Open an account in Australia
• Open an account in Singapore
- Search for the company you want to trade in our award-winning platform
- Choose your position and size, and your stop and limit levels
- Place the trade
Latest market news
Yesterday 01:32 PM
Yesterday 09:35 AM
Yesterday 07:23 AM
Yesterday 04:48 AM
Yesterday 12:17 AM
July 25, 2024 10:39 PM
Latest Trading FOREX articles

August 22, 2023 02:00 PM

August 14, 2023 09:00 AM

August 10, 2023 08:15 AM

July 31, 2023 08:30 AM