


- The Federal Reserve delivered a clear dovish message to markets in March
- Its willingness to cut rates increases the risk of a reacceleration in growth and inflation
- We look at the probable market winners and losers from a higher growth, higher inflation environment
- Longer-term trading setups in gold, USD/JPY and TLT ETF are examined
The Federal Reserve may say it’s committed to return inflation to its 2% mandate, but by signalling it plans to reduce interest rates in an environment of above trend economic growth, full employment and sticky inflation, markets aren’t buying the message. Market-based inflation expectations - shown in the chart below - are moving in the wrong direction.
What markets are buying are commodities and stocks. Gold has already hit record highs, US S&P 500 futures too.
Until we see inflation expectations return to acceptable levels, either by the Fed being forced to curtail its rate cut expectations or economic activity slowing sharply, that will likely be the playbook markets adopt, along with placing pressure on the US dollar. The big risk will be if economic growth doesn’t slow down and inflation expectations pick up, a scenario that may pressure longer-dated US Treasuries at a time when the US government is running record non-crisis era deficits.
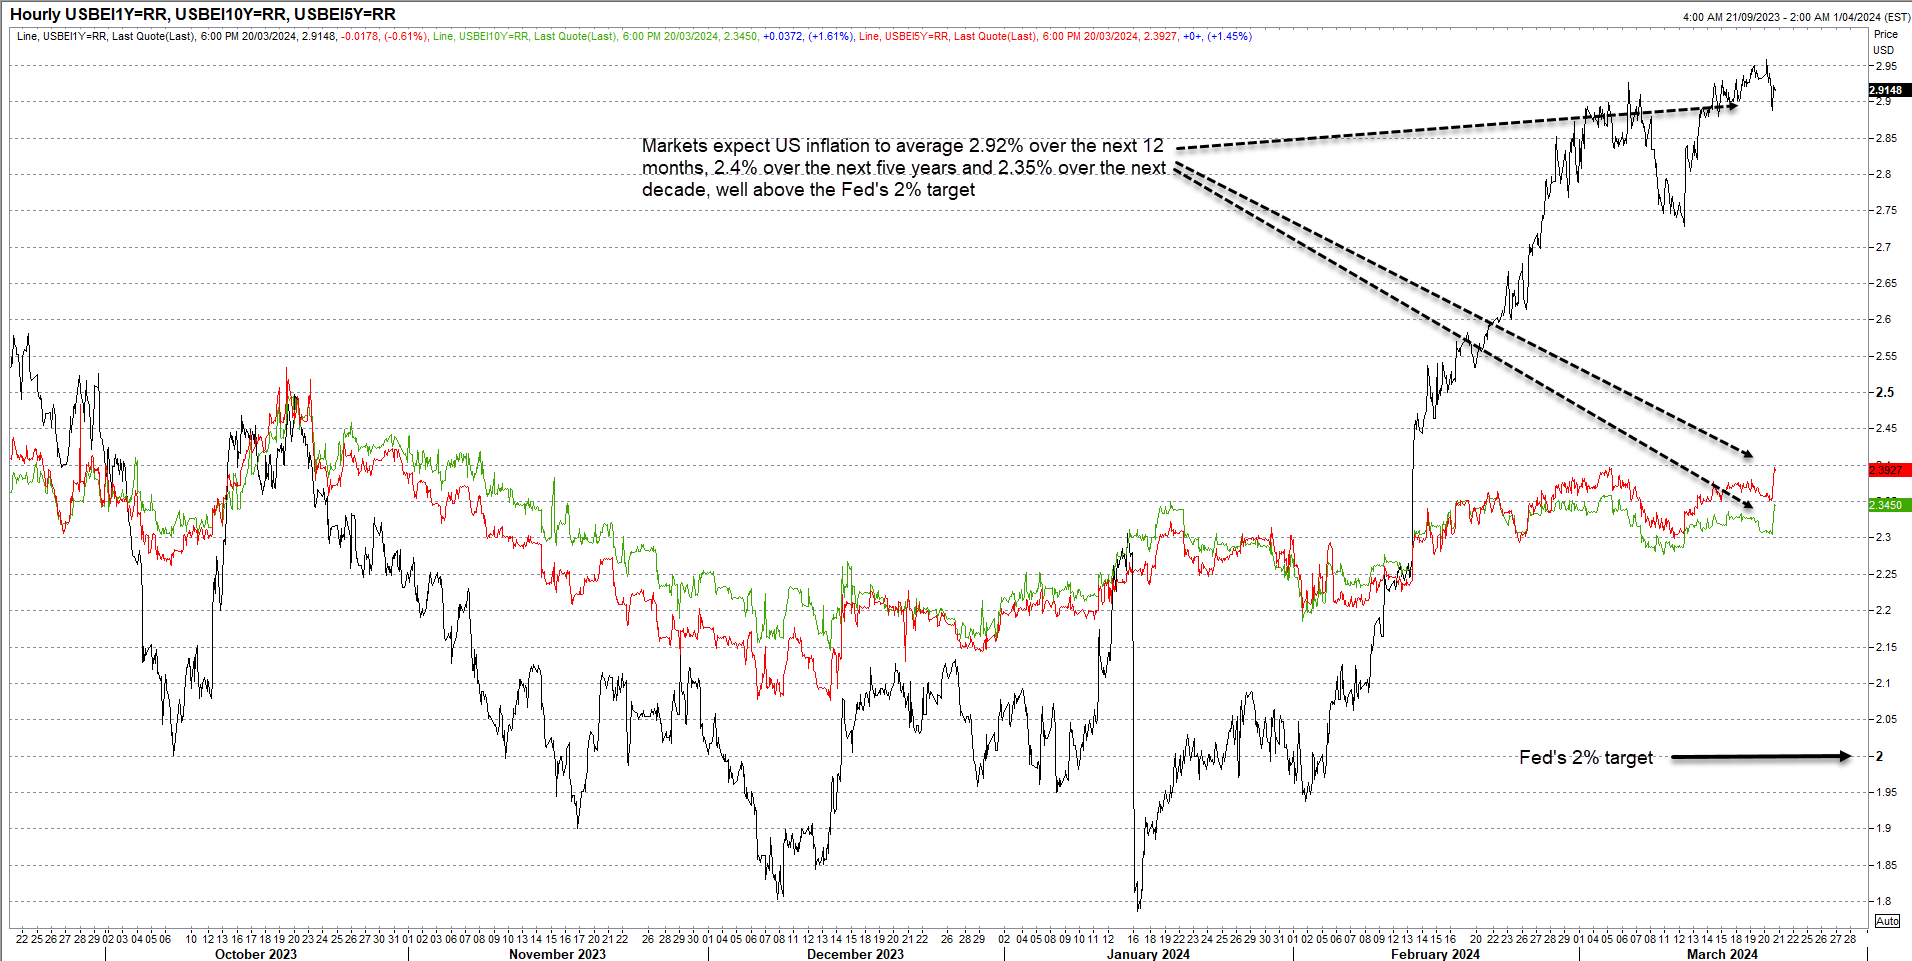
Source: Refinitiv
My two cents on the Fed messaging
There’s been plenty written about the Fed already, so I’ll keep my two cents quick. The biggest takeaway was the Fed remains intent on cutting rates this year, showing disregard about looser financial conditions and the threat it poses to growth and inflation reaccelerating.
Jerome Powell was given an opportunity to push back against financial markets movements and didn’t. He was given the opportunity to push back on easing being delivered as soon as May and didn’t, choosing a very different approach to when asked a similar question in January about a potential move in March.
Powell did not appear bothered about the Fed signalling multiple rate cuts despite its GDP, unemployment and inflation forecasts being far more hawkish than three months ago. He emphasised its dual mandate of full employment and price stability, noting strong employment growth was not an impediment to cutting rates. But if the labour market weakened, it was ready to do so.
He also suggested the pace of quantitative tightening may be tapered “fairly soon”, providing a positive signal on liquidity conditions for markets.
Put succinctly, Powell and co were undeniably dovish, reducing the risk of a hard landing while simultaneously increasing the risk that growth and inflation may takeoff again.
Markets position for higher growth and inflation environment
It’s not surprising the markets reacted the way they did.
Easing monetary policy into an environment of record non-crisis era government deficits points to the potential for higher nominal economic growth and inflation, something that should fuel revenue growth and boost prices hard assets, especially those supply constrained.
As mentioned at the top, unless we see the environment shift dramatically, the market reaction seen immediately after the Fed decision and presser comes across as correct. As such, traders should take note when assessing setups looking ahead.

Potential market winners and losers
Generally, the US dollar may struggle as yield differentials work against it. Commodities priced in dollars have been provided a new tailwind, pointing to outperformance in parts of the complex. Developed market stocks are likely to enjoy the environment, making them a buy on dips prospect. A softer US dollar would generally be supporting of emerging markets.
While shorter-dated US Treasuries should be bolstered by Fed easing expectations, longer-dated bonds could come under pressure should inflation expectations keep moving further away from the Fed’s 2% mandate. That’s a wildcard that could seriously disrupt markets, but more likely on a medium-to-longer term timeframe.
Given the shifting backdrop, markets exposed to USD or US interest rate exposure are a focal point. Today, we look at gold, USD/JPY and the TLT ETF.
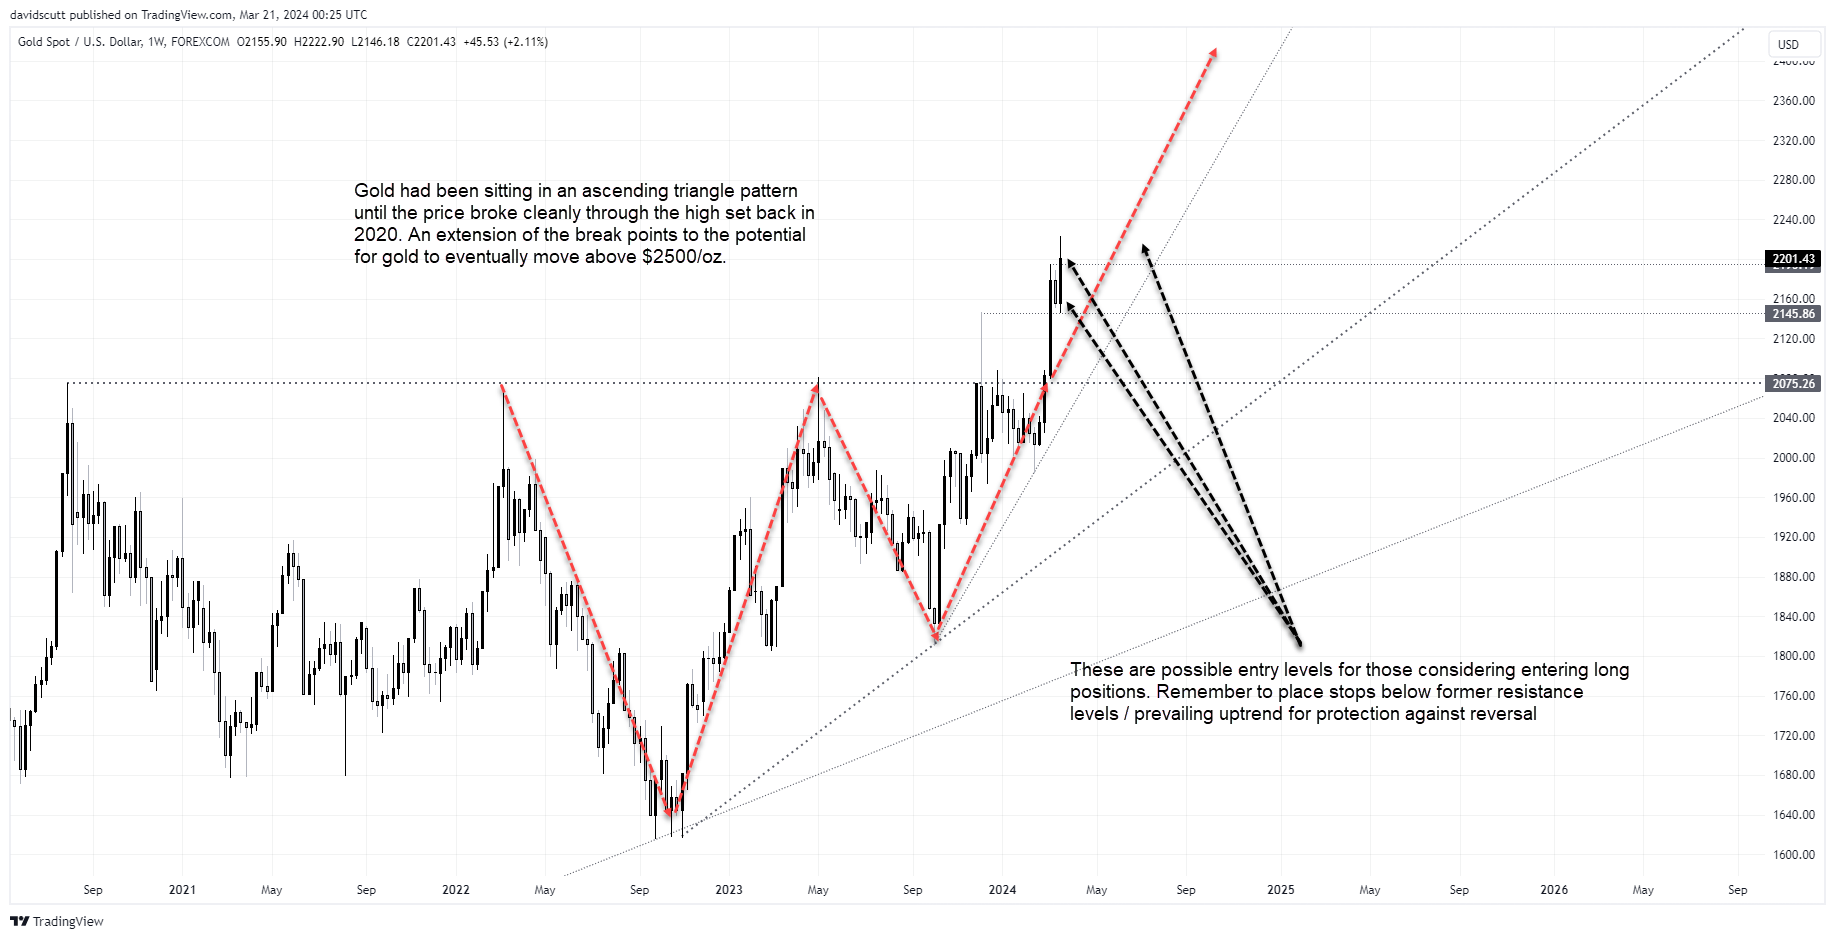
Gold rams to record highs
Gold didn’t wait long to take out its previous record high following the Fed, triggering stops above the level within hours, sending the price hurtling above $2200 per ounce. Trading at levels never seen before can limit the usefulness of technical analysis. However, zooming out to a weekly timeframe reveals gold was trading in an ascending triangle pattern prior to the clean break of the prior record high set in 2020. An extension of the initial range suggests a move above $2500 is possible.
While an imminent move of that magnitude is extremely unlikely, it suggests buying dips remains the way to play it until we see meaningful evidence of the uptrend breaking down. I’ve indicated on the chart possible entry levels for longs, providing traders with known levels where stops can be placed below for protection.
USD/JPY eyes bullish break but rate differentials a headwind
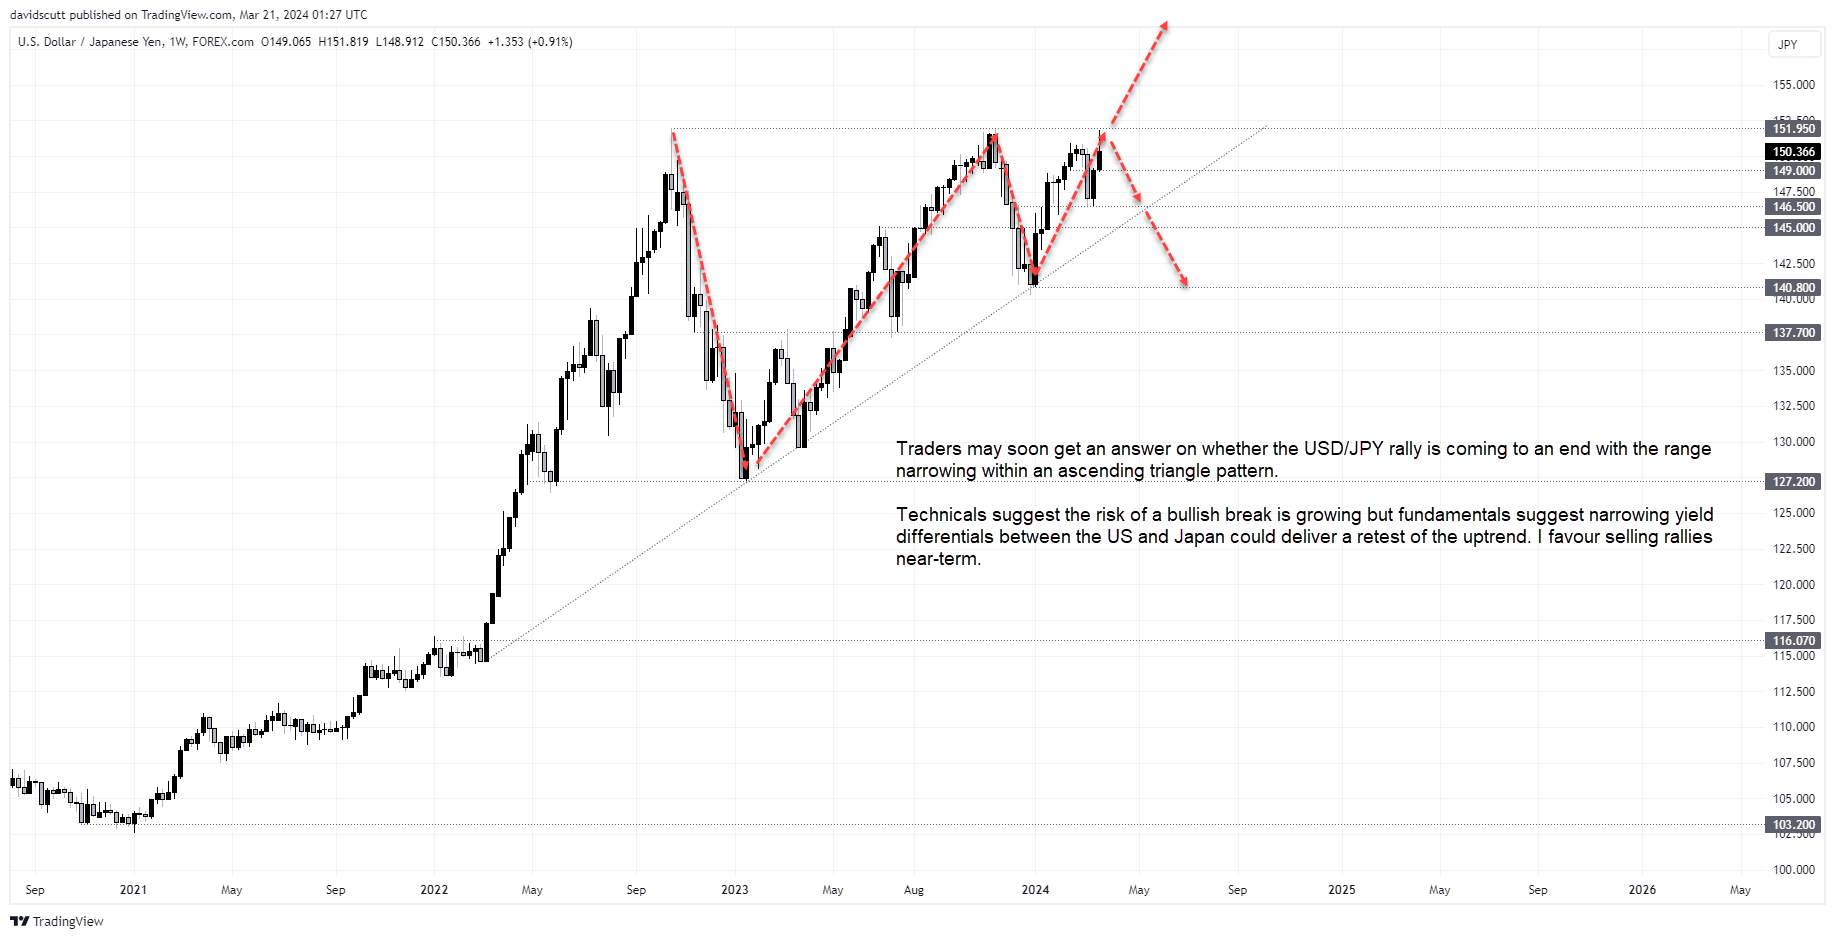
Valued against the USD and heavily influenced by US interest rates, USD/JPY is another market traders may want to watch. Like gold, it too looks to be sitting in an ascending triangle pattern, although it’s yet to break to new highs.
While the potential is there, given the dovish signal provided by the Fed, and knowing how influential yield differentials between Japan and US are on determining how USD/JPY trades, the fundamentals for a breakout have diminished this week with the Fed continuing to signal easier policy while the BOJ hiked for the first time in 17 years, narrowing the yield gap between the two nations. Buoyant risk appetite, assisting capital being exported around the world from Japan, is likely limiting downside in USD/JPY for now.
Whether it breaks to the topside or downside, given where USD/JPY sits on the weekly, it looks like we may get an answer soon. Buying a topside break allows traders to place a stop below the former high of 151.95, targeting another leg higher. An extension of the triangle range suggests the pair may eventually top 180. Looking on the long-term charts, resistance is likely to be encountered at 160 and 180.
Nearer-term, fading the prevailing trend is favoured, bringing a potential reversal towards 149 or 146.50 into play, along with the uptrend established in early 2022 when the Fed first flagged rate hikes were coming. Should the uptrend break, traders may revert from buying dips to selling rallies.
This is a chart to keep an eye on given how far USD/JPY could move in either direction.
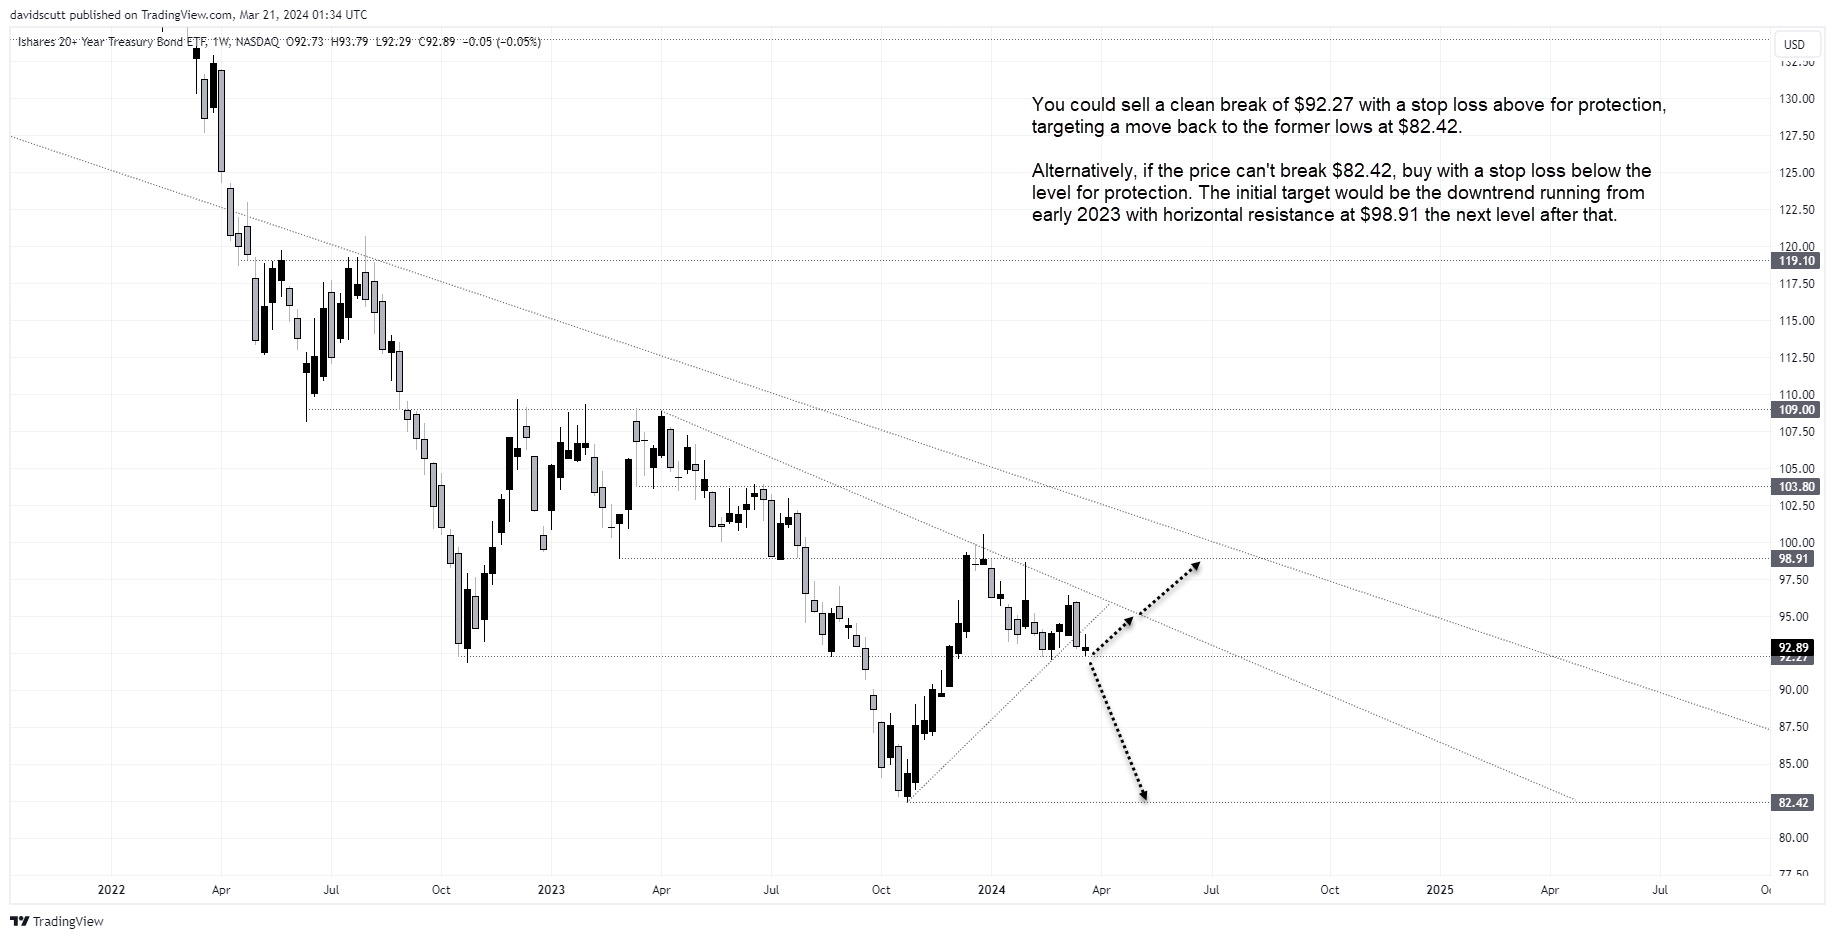
TLT ETF a proxy for potential market turmoil
As for the risk of a selloff in longer-dated US government bonds flagged earlier, the TLT ETF should be on the radar given the decent trading setup and implications for markets and borrowing costs. I’m not going to go into extensive details – I posted an identical trade idea involving the ETF here earlier in the week – but the longer inflation expectations are allowed to remain well above the Fed's target, the greater the downside risk for long bond prices.
-- Written by David Scutt
Follow David on Twitter @scutty
How to trade with City Index
You can trade with City Index by following these four easy steps:
-
Open an account, or log in if you’re already a customer
• Open an account in the UK
• Open an account in Australia
• Open an account in Singapore
- Search for the market you want to trade in our award-winning platform
- Choose your position and size, and your stop and limit levels
- Place the trade
Latest market news
April 25, 2024 03:09 PM
April 25, 2024 03:00 PM
April 25, 2024 01:12 PM
Latest Equities articles

April 12, 2024 02:28 AM

April 7, 2024 08:46 PM

March 31, 2024 11:22 AM
