


- Gold analysis: why are precious metals rising?
- Silver could outshine gold
- Gold analysis: technical levels and factors to watch
Welcome to another edition of Technical Tuesday, a weekly report where we highlight some of the most interesting markets that will hopefully appease technical analysts and traders alike. In this week’s report, we will analysis gold and silver following last week’s bullish price action.
Gold recovered from a weaker start to the week to climb back above the $2K mark at the time of writing on Tuesday. The recovery means gold has now turned positive on the week, which could trigger follow-up buying momentum given last week’s bullish reversal-looking price action. As noted in my precious metals report on Monday, gold and silver were highly likely to rebound amidst the prevailing narrative of peak interest rates, which was not going to change given the fact we didn’t have any important data or central bank speeches at the start of this week.
Gold analysis: why are precious metals rising?
Supporting gold and silver prices are the continued weakness we have seen in bon yields, reducing the opportunity cost of holding assets that don’t pay any interest or dividends. The drop in yields accelerated following the sharper than expected drop in US CPI, reinforcing the anticipation that the Fed (as well as other central banks) will refrain from further rate hikes. The more prominent the narrative of "peak interest rates" becomes, the stronger the support is likely to be for gold and silver prices. So, watch out for further US data misses. Tuesday’s only piece of data was existing home sales, which came in weaker.
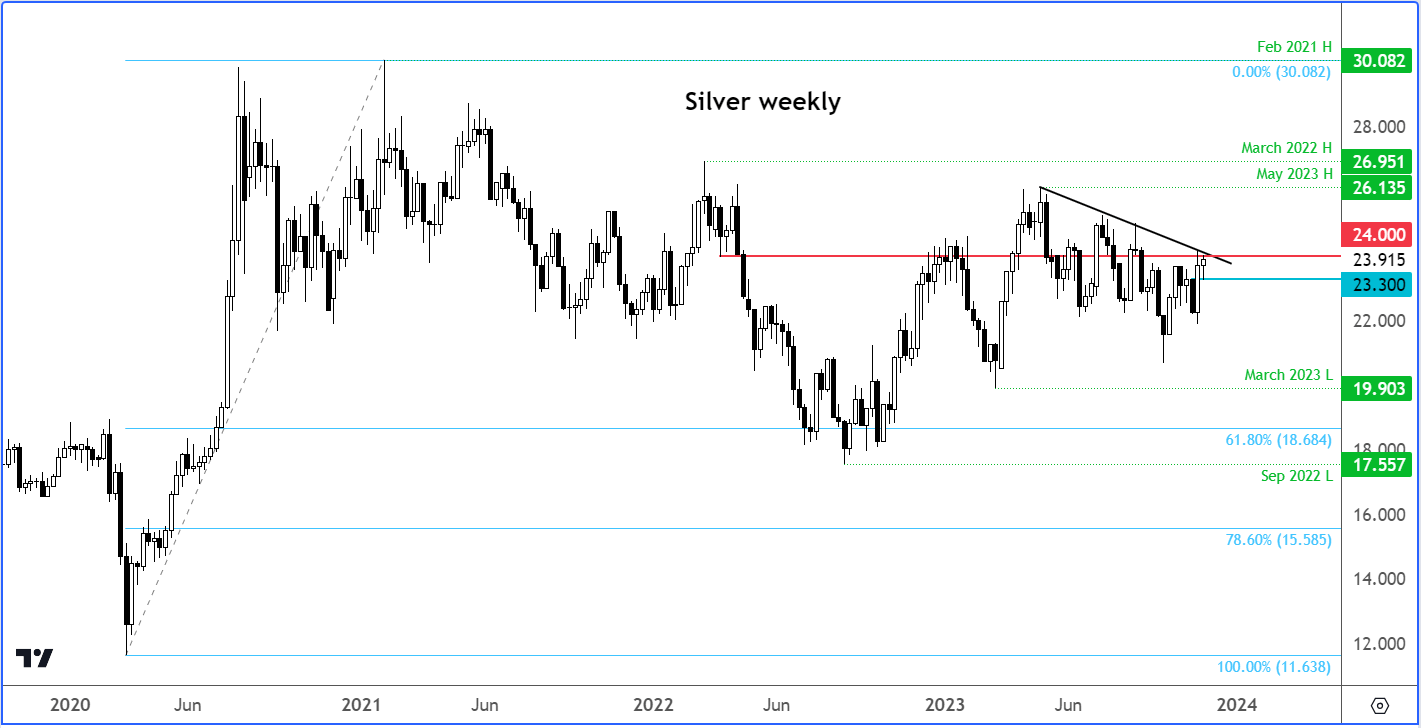
Silver could outshine gold
Out of the two metals, silver stands a chance to outside gold since we are in a positive market environment where stock prices have also been on the ascendency. Investors in precious metals are optimistic about the prospect of the next interest rate adjustment in the US being a cut, possibly occurring as early as the second quarter. This optimism is fuelled by emerging signs indicating a consistent easing of inflation towards the Federal Reserve's long-term 2% average target. At the time of writing, silver was near the day’s highs, after bouncing nicely off its 200-day average near $23.30 support area.
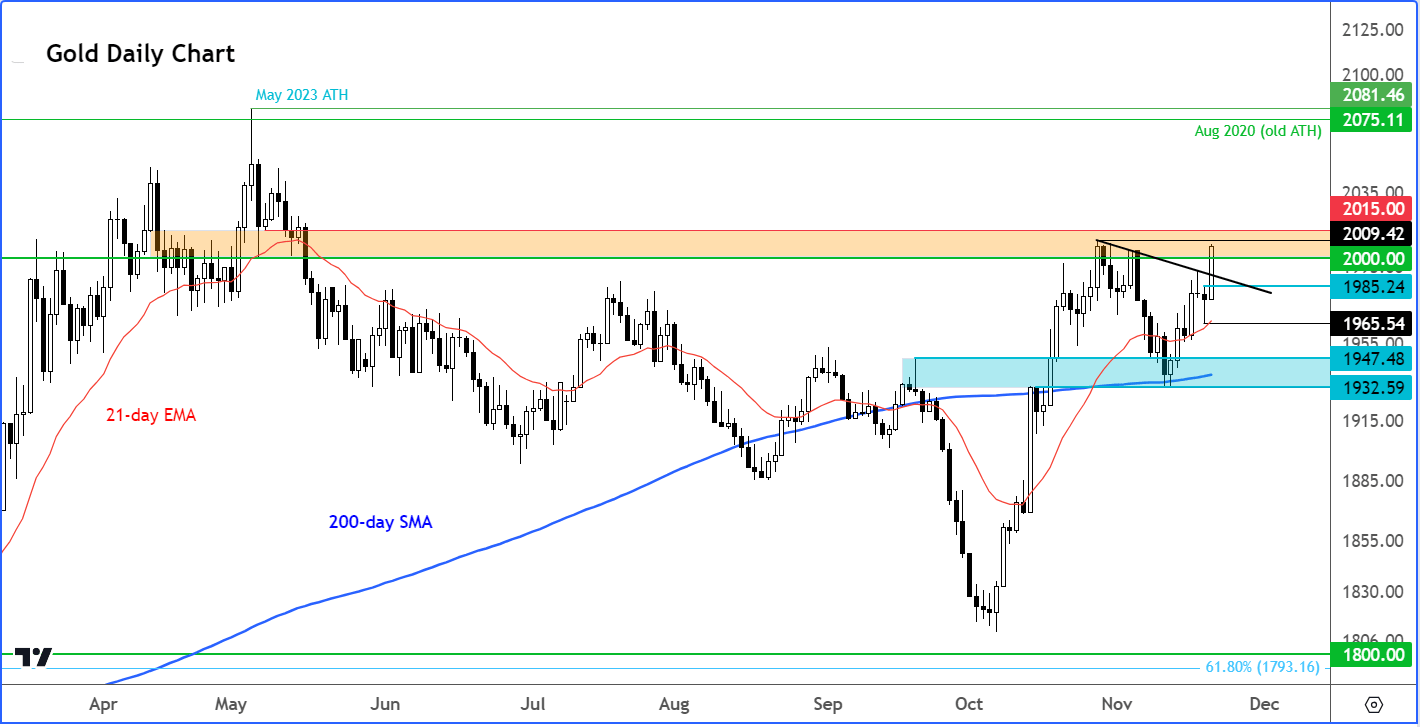
Gold analysis: technical levels and factors to watch
Gold’s technical outlook continues to improve for the bulls. The big turnaround was when the precious metal staged a V-shaped recovery between September and October. Just after the middle of October, gold then created a higher high when it also broke back above the 200-day moving average. The metal then went on to climb above $2000 for a while, reaching a peak in October of just under $2010, before correcting lower. The correction lasted a few weeks, but gold bulls came out in the middle of November and defended their ground right where they needed to, around the $1932-$1945 area, which was previously resistance and where the 200-day average was residing. In more recent days, gold has been trending higher again, leading to a break above the 21-day moving average and some short-term resistance levels in the process.
With the path of least resistance clearly to the upside, any short-term dips back into support levels could be defended moving forward. The high of last week comes in at $1993 and that of Monday’s range is at $1985. Therefore the key short-term support area to watch for potential dip-buying price action moving forward in between $1985 to $1993.
On the upside, there are not many reference points lefts for the bulls to target now until the old highs of $2075, hit in 2020 which was superseded momentarily in May 2023 by a few bucks when gold formed a fresh record high at just above $2081. The immediate focus will be on October’s highs of just under the $2010 level. The bulls will want to see gold break and hold above this level now. If so, this would increase the likelihood of gold rising to a fresh record in the not-too-distant future.
Source for all charts used in this article: TradingView.com
-- Written by Fawad Razaqzada, Market Analyst
Follow Fawad on Twitter @Trader_F_R
How to trade with City Index
You can trade with City Index by following these four easy steps:
-
Open an account, or log in if you’re already a customer
• Open an account in the UK
• Open an account in Australia
• Open an account in Singapore
- Search for the company you want to trade in our award-winning platform
- Choose your position and size, and your stop and limit levels
- Place the trade
Latest market news
Today 05:56 AM
Yesterday 11:57 PM
Yesterday 08:00 PM
Yesterday 02:00 PM
Latest Technical Tuesday articles

April 23, 2024 04:00 PM

April 16, 2024 04:54 PM

April 9, 2024 11:30 AM

April 2, 2024 04:00 PM