


- Dollar analysis: DXY makes higher to print new bullish signal
- EUR/USD analysis: Path of least resistance to the downside
- Nasdaq analysis: Tech stocks on watch as yields press higher
- DAX analysis: Cracks starting to appear for German index
Welcome to Technical Tuesday, a weekly report where we highlight some of the most interesting markets that will hopefully appease technical analysts and traders alike.
In this edition of Technical Tuesday, we will analyse the US Dollar Index, EUR/USD, DAX and Nasdaq.
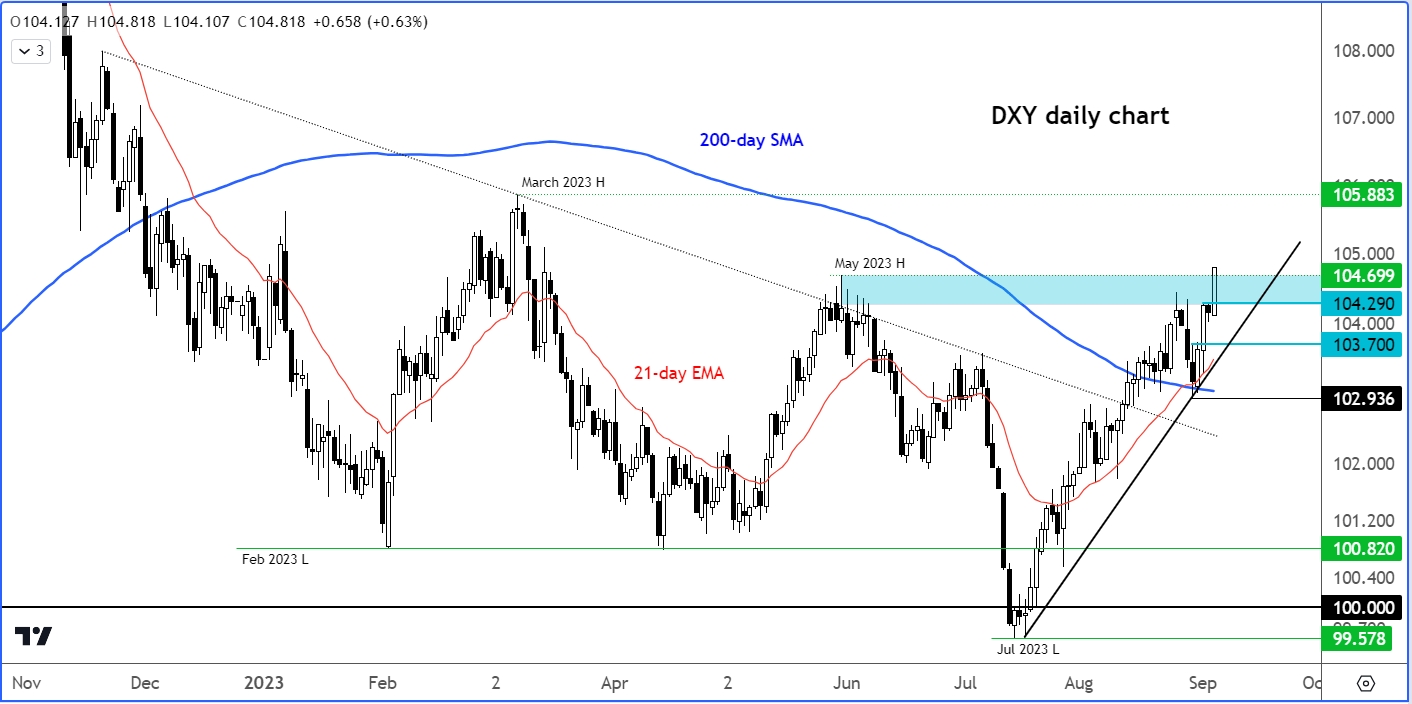
Dollar analysis: DXY makes higher to print new bullish signal
The dollar index has broken above its recent highs and resistance in the range between 104.29 to 104.70. This area was strong resistance back in May and at the back end of August. Now that the dollar has cleared this zone, any retest of this zone from above will need to be defended by the bulls to maintain control. Judging by how the dollar has been performing of late, we would expect this to be the case until there is a fundamental trigger to change the dollar’s bullish trend. The high made in March at 105.88 is the next target for the bulls. We will maintain a bullish view on the dollar index until it creates a key reversal pattern or makes a lower low beneath 102.93.
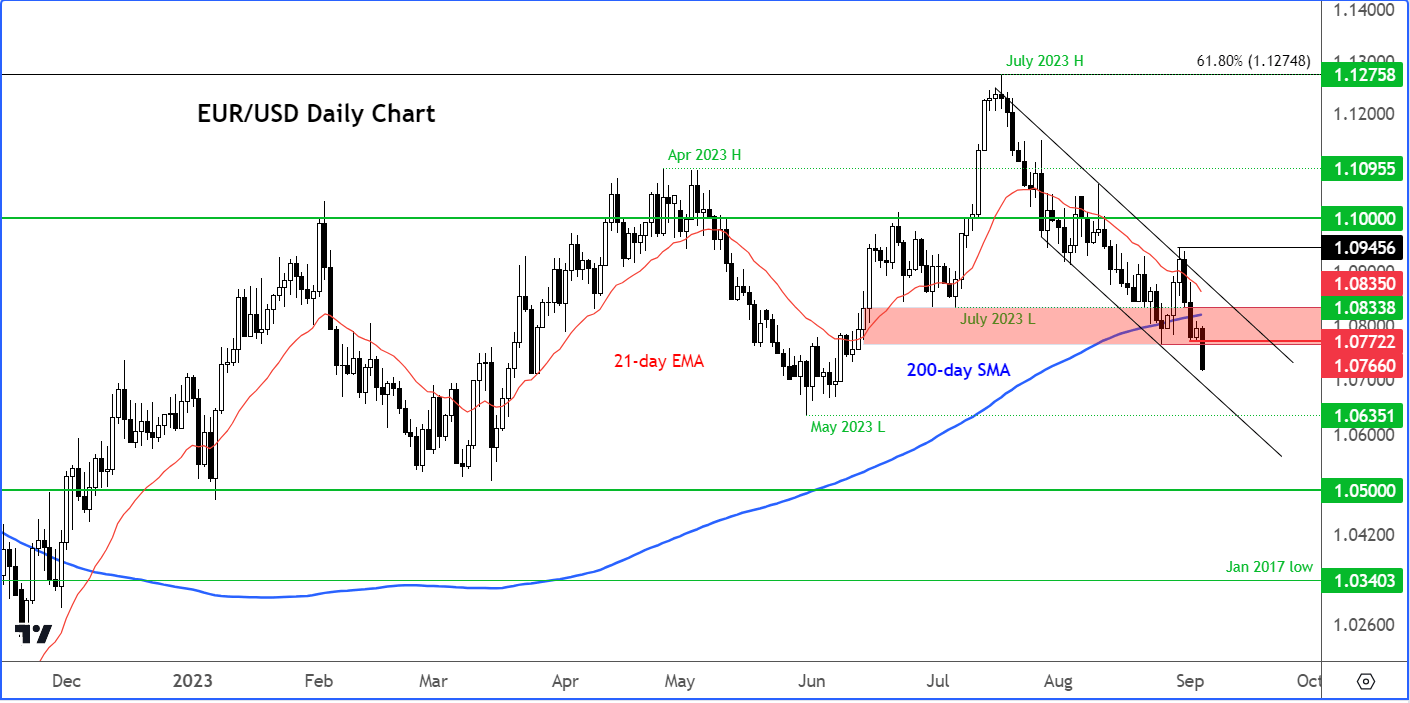
EUR/USD analysis: Path of least resistance to the downside
As mentioned in my report yesterday, the path of least resistance remained to the downside for the EUR/USD. Lo an behold, it has fallen even further today as data continues to disappoint from the Eurozone. The bearish signal was provided on Friday when it closed below the 200-day average. Given the lower lows and lower highs, and the overall bearish price structure on this pair, today’s move below the recent low at 1.0766 should now come as surprise. If rate close below this level today then any rebound back into 1.0766 or slightly higher could be faded in the days to come.
As things stand, therefore, the path of least resistance remains to the downside on the EUR/USD. The bulls will need to wait for a confirmed reversal signal, as the selling pressure could easily gather momentum with more and more support levels breaking down. A move below the May 2023 low at 10635 looks the more likely outcome than a rally back to 1.10 area.
Nasdaq analysis: Tech stocks on watch as yields press higher
With crude oil surging, this could give rise to concerns over another round of inflation and boost to bond yields. That in turn could hurt growth stocks and weigh on the Nasdaq. From a technical point of view, the index is not looking too bearish yet, but it is one that needs to be watched closely here. A decisive move below support at 15370 could trigger a sell-off as the bulls rush for the exits. So, just keep an eye on this index, even if you don’t trade it as it could get interesting. The bulls meanwhile will now want to see a move above the July high to regain full control again.

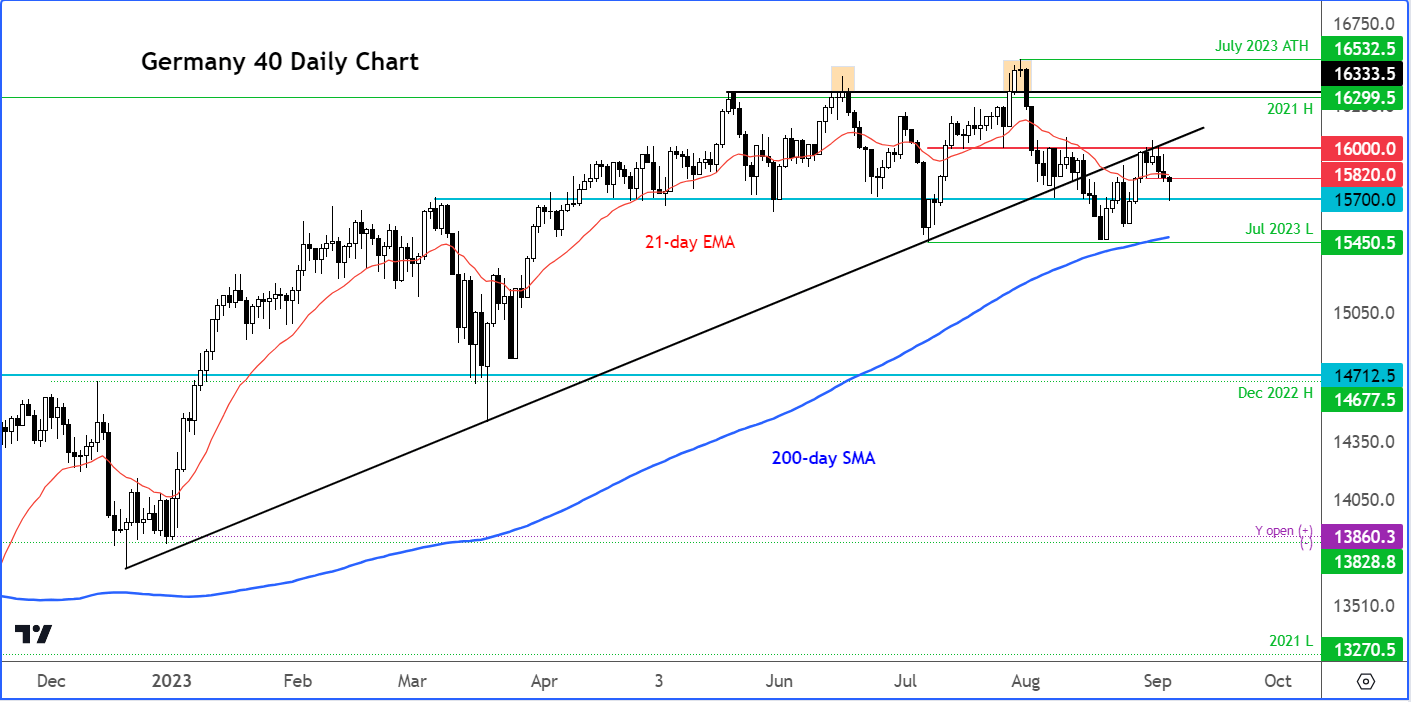
DAX analysis: Cracks starting to appear for German index
The European version of the Nasdaq is the DAX index which contains a number of tech stocks. The German index has managed to bounce off its earlier lows, but at the time of writing it was testing resistance at 15820, previous support. The bears will need to hold their ground here if they want to see lower levels. With the bullish trend line broken, the path of least resistance appears to be to the downside. So, watch out below. A move below support at 15700 could pave the wat for the July low at 15450. And if we break that level decisively, then we could be in for a volatile period in the markets.
Meanwhile, the bulls will want to see a close back above 15820, as that would create a hammer-like candle. Should that happen, then the bulls will eye 16000 next.
Source for all charts used in this article: TradingView.com
-- Written by Fawad Razaqzada, Market Analyst
Follow Fawad on Twitter @Trader_F_R
How to trade with City Index
You can trade with City Index by following these four easy steps:
-
Open an account, or log in if you’re already a customer
• Open an account in the UK
• Open an account in Australia
• Open an account in Singapore
- Search for the company you want to trade in our award-winning platform
- Choose your position and size, and your stop and limit levels
- Place the trade
Latest market news
Today 05:56 AM
Yesterday 11:57 PM
Yesterday 08:00 PM
Yesterday 02:00 PM
Latest Technical Tuesday articles

April 23, 2024 04:00 PM

April 16, 2024 04:54 PM

April 9, 2024 11:30 AM

April 2, 2024 04:00 PM