


Key takeaways
- FTSE 100 has underperformed compared to indices in Europe and the US in 2023
- Comes after the index outperformed in 2022 by avoiding the market rout
- Lack of technology exposure means it has missed out on the boom this year
- FTSE 100 is cheap and trading at a large discount to its historic average
- Could continue to underperform unless attention turns to recession or we see a revival in global economic growth
- But downside risks attached to the FTSE 100 are limited
- Banks and oil giants among the cheapest stocks in the FTSE 100 at present
How has the FTSE 100 performed in 2023?
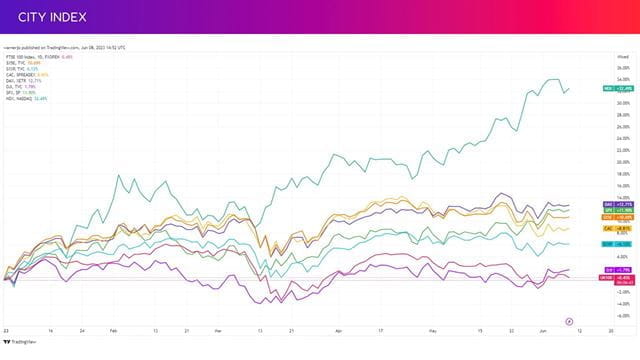
Stock markets have gained ground in 2023, but the FTSE 100 – which tracks the top 100 largest UK-listed companies – has significantly underperformed after rising less than 1% year-to-date.
That compares to much stronger gains seen elsewhere. In Europe, the STOXX 600 has risen 6% and Germany’s DAX and France’s CAC 40 have risen at an even faster rate, while over the Atlantic we have seen the S&P 500 rally over 11% while the Nasdaq 100 has led the pack after soaring over 31%.
Why is the FTSE 100 underperforming?
The underperformance of the FTSE 100 this year comes after UK blue-chip stocks proved far more resilient during the rout we saw in global markets in 2022. As the pandemic-fuelled boom in value unravelled across Europe and the US last year, with indices falling between 10% to 33%, the FTSE 100 held up much better an eked out a 0.9% rise. That was the result of the sharp drop in the pound providing a tailwind for the index’s many exporters and a more robust performance from its many non-cyclical constituents.
The tables have turned this year. Many of the stocks that took a battering in 2022 in the US and Europe have rebounded this year and fuelled stronger gains outside the UK. The UK index has also suffered because it lacks the array of tech stocks that have fuelled the rally over in the US, where indices have recently hit fresh 2023-highs. Tech stocks make up just 1% of the FTSE 100, which is more geared toward stocks in the financial, commodity, healthcare and industrial goods and services sectors.
UK stocks may have also lagged as the country is having a tougher time bringing down inflation and has grown at a slower rate than countries on the continent and in the US since the pandemic.
Is the FTSE 100 cheap?
UK stocks are certainly cheap compared to counterparts over the Channel and the Atlantic whether you look at the trailing or forward price-to-earnings ratio. It trades at a PE ratio of below 11.0x on both counts, lower than its European counterparts and around half of what we are seeing over in the US.
Below is a table outlining the price-to-earnings ratios of major European and US indices based on earnings over the past 12 months and forward earnings estimates:
|
Index |
Trailing P/E Ratio |
Forward P/E Ratio |
|
FTSE 100 |
10.8x |
10.4x |
|
Euro STOXX 600 |
13.5x |
12.6x |
|
Euro STOXX 50 |
12.6x |
12.0x |
|
CAC 40 |
12.4x |
12.4x |
|
DAX |
13.0x |
10.8x |
|
Dow Jones Industrial Average |
19.5x |
16.8x |
|
S&P 500 |
20.4x |
18.5x |
|
Nasdaq 100 |
31.5x |
25.8x |
(Source: Bloomberg, as of 08/06/2023)
The FTSE 100 is also trading at a huge discount compared to its historic average considering the index has traded at an average trailing PE ratio of 14.9x over the last five years and 16.3x over the past decade. European indices are also trading at a discount, but a smaller one than what the UK is experiencing, while US indices are all trading above their 10-year average.
Currently, brokers have Buy ratings on 51 of the stocks in the FTSE 100 and Hold on 48, with just 1 Sell on ABRDN. That suggests analysts see limited downside potential from the index and suggests there is upside to the current outlook.
Still, it may prove difficult for the FTSE 100 to outperform in the current environment. The defensive nature of the index may reap rewards if the market’s minds shift from concerns over rising interest rates and inflation to worrying over a recession, while a revival in economic growth would also bode well.
Lacking that, the FTSE 100 is likely to keep underperforming. However, last year also showed us that the FTSE 100 can hold up well during tougher times relative to other indices, suggesting downside potential is restricted despite the uncertain economic outlook.
FTSE 100 analysis: Winners and losers of 2023
Here is a table outlining the best and worst performers in terms of share price movement in the FTSE 100 since the start of 2023 to June 8:
|
Top 10 winners in 2023 |
% Gain |
Top 10 losers in 2023 |
% Loss |
|
3i Group |
49.3% |
Ocado |
-43.5% |
|
Rolls Royce |
48.8% |
Fresnillo |
-24.9% |
|
Flutter Entertainment |
34.5% |
Anglo American |
-24.4% |
|
BT Group |
28.5% |
BAT |
-22.4% |
|
Centrica |
26.7% |
Glencore |
-19.5% |
|
Melrose |
26.4% |
Johnson Matthey |
-17.4% |
|
B&M |
25.7% |
Imperial Brands |
-17.3% |
|
Rentokil |
24.4% |
British Land |
-13.9% |
|
Whitbread |
24.0% |
Pearson |
-13.5% |
|
IAG |
23.0% |
ConvaTec |
-13.3% |
FTSE 100 analysis: What are the cheapest UK stocks?
There are some big names going cheap in the FTSE 100 when we look at data from Bloomberg. There are two standout sectors – banks and oil – with Barclays, NatWest, Lloyds, Standard Chartered, HSBC, BP and Shell all boasting lowly valuations of below 7.0x in terms of blended-forward PE ratio.
Below is a table outlining the top 10 cheapest and most expensive FTSE 100 stocks based on their blended-forward price-to-earnings ratio, using data from Bloomberg. As expected, we can see some correlation with performance as many of the worst performers are among the cheapest while some of the best performers look pricey:
|
Top 10 cheapest FTSE 100 stocks |
BF PE Ratio |
Top 10 expensive FTSE 100 stocks |
BF PE Ratio |
|
Barclays |
4.6x |
Flutter Entertainment |
32.5x |
|
NatWest |
5.5x |
Halma |
30.2x |
|
Imperial Brands |
5.8x |
United Utilities |
30.1x |
|
Lloyds |
6.0x |
Severn Trent |
29.4x |
|
BP |
6.0x |
Melrose Industries |
28.2x |
|
Standard Chartered |
6.1x |
Spirax-Sarco Engineering |
27.5x |
|
HSBC |
6.3x |
Rentokil |
26.8x |
|
Shell |
6.4x |
Sage Group |
26.1x |
|
3I Group |
6.5x |
Experian |
24.9x |
|
IAG |
6.5x |
Croda International |
24.2x |
(Source: Bloomberg, as of 08/06/2023)
How to trade the FTSE 100
You can trade the FTSE 100 through the UK 100 with City Index in just four easy steps:
- Open a City Index account, or log-in if you’re already a customer.
- Search for ‘UK 100’ in our award-winning platform
- Choose your position and size, and your stop and limit levels
- Place the trade
Or you can practice trading risk-free by signing up for our Demo Trading Account.
Latest market news
Yesterday 01:32 PM
Yesterday 09:35 AM
Yesterday 07:23 AM
Yesterday 04:48 AM
Yesterday 12:17 AM
July 25, 2024 10:39 PM
Latest Equities articles


June 8, 2024 02:00 AM

June 3, 2024 05:56 AM

June 3, 2024 03:34 AM