


After just dodging a “bear market” intraday decline of -20% (at least so far) to start the year, the widely-followed Nasdaq 100 index (US Tech 100) has stabilized in choppy trade below 15,000 over the last week.
Fundamentally speaking, the big factor driving the tech-heavy index in recent weeks has been earnings. Looking at just the most heavily-weighted components of the index, we’ve seen earnings reports beating expectations at Apple, Microsoft, Amazon, Alphabet, and Tesla, though these gains were partially offset by big misses from Meta and Netflix. Nvidia, with a 3.9% weighting in the index, is expected to report earnings on Wednesday, February 16th after the bell.
The other key fundamental driver to watch when trading the Nasdaq 100 is interest rates. As traders price in the potential for more aggressive interest rate hikes from the Federal Reserve, we’ve seen the yield on the benchmark 10-year treasury bond surge from under 1.40% at the start of Christmas week to approach 2.00% this week. As a reminder, rising yields increase the cost of capital for companies and make bonds a (slightly) more compelling alternative for investment funds than equities. While we doubt many traders are directly selling their shares in fast-growing tech behemoths like Apple and Amazon to buy a government bond yielding less than 2%, this shift nonetheless influences flows at the margin.
In any event, the Nasdaq 100 index is trading up by more than 1.5% on the day to regain its 200-day EMA and test the 15,000 area. Moving forward, there are key levels of previous support and resistance to watch roughly every 1,000 points:
- 16,500: Major resistance near the all-time highs
- 15,500: Previous-support-turned-resistance from December and January
- 14,500: Previous support dating back to July, as well as this week’s low
- 13,700: The year-to-date low
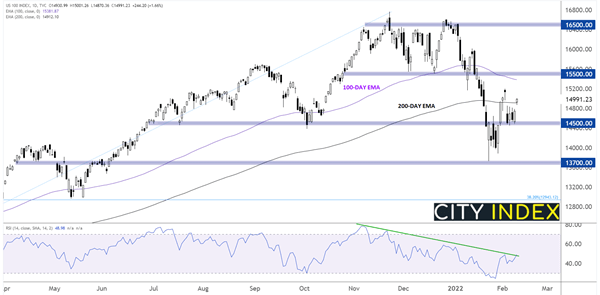
Source: TradingView, StoneX
Short-term traders may want to mark these levels on their charts and use them as levels to frame trades around in the days and weeks to come (e.g. look for sell opportunities if the index rallies to 15,500, or buy if it breaks above, targeting the next level at 16,500, etc). By understanding the key signposts along the way, traders can keep their bearings and stay on track, even amidst market volatility.
How to trade with City Index
You can trade with City Index by following these four easy steps:
-
Open an account, or log in if you’re already a customer
• Open an account in the UK
• Open an account in Australia
• Open an account in Singapore
- Search for the company you want to trade in our award-winning platform
- Choose your position and size, and your stop and limit levels
- Place the trade
Latest market news
Yesterday 01:32 PM
Yesterday 09:35 AM
Yesterday 07:23 AM
Yesterday 04:48 AM
Yesterday 12:17 AM
July 25, 2024 10:39 PM
Latest Tech Stocks articles

October 19, 2023 09:47 AM

October 18, 2023 12:06 PM

October 11, 2023 02:41 PM

October 3, 2023 12:24 PM