


- Gold and silver analysis: Can silver catch up with yellow metal?
- All eyes on US CPI this week
- Silver technical analysis point to a potential breakout
Video: Gold and silver analysis
Gold and silver will remain in focus this week with key inflation data to come from the US on Tuesday. Following gold's consecutive all-time highs last week, silver might emerge from its prolonged consolidation phase and begin to close the gap with the yellow this week. A rise towards $30 seems plausible. However, there's no significant obstacle preventing silver from reaching its own peak at some stage this year. Considering the all-time highs achieved by several other assets such as gold, Bitcoin, and various stock indices, it's reasonable to entertain the possibility of silver also hitting a record $50 at some point in the year.

Gold and silver analysis: Can silver catch up with yellow metal?
Gold’s ascend to new record highs is hardly surprising. Years of persistent inflation and the depreciation of fiat currencies have heightened interest in gold (and Bitcoin), viewed by many as the ultimate store of value and a reliable hedge against inflation. However, silver hasn't experienced the same boost. Not yet anyway.
So why has silver underperformed? I think the crux of the matter lies in silver's dual role as both a precious metal and an industrial material. This duality has worked against it, particularly amid concerns about reduced demand from China for industrial metals.
Nevertheless, with indications of a turnaround in China and the government's ambitious 5% growth target, there could be a resurgence in demand for industrial commodities like copper and silver this year. This might just be the year for silver, following its prolonged underperformance and the absence of significant movements since the peak of the pandemic in 2020.
Gold and silver analysis: All eyes on US CPI this week
Looking at the near-term macro perspective, it is all about the next rate cut by the Federal Reserve for FX and precious metals traders, which could be the start of long cycle of rate cuts, inflation permitting.
Last week, Fed Chair Jerome Powell's testimony was interpreted as dovish, shifting attention towards upcoming US data. Some mild concerns arose from Friday's mixed US jobs data, which pointed to a potential weakening in the labour market when you consider the downward revision to prior month’s figures and an unexpected rise in unemployment rate, even as the headline jobs growth beat expectations. The mixed jobs data followed a series of generally weaker US data releases over the past couple of weeks, which have pressured bond yields across the board and bolstered precious metals.
The highlight on the macroeconomic calendar this week is the release of US inflation data on Tuesday. Consensus anticipates a 3.1% year-over-year and a 0.4% month-over-month rise in CPI. Should the actual data fall short of these expectations, or if core CPI fails to meet the projected +0.3% month-over-month figure, it could intensify calls for a rate cut in June and undermine the dollar.
However, a stronger-than-expected inflation report could potentially disrupt the rally in gold and impede silver's progress as well. Nevertheless, considering the dollar's response to robust inflation data last month, any gains the US dollar might experience from unexpectedly high inflation could be short-lived.
Silver technical analysis
Silver’s charts are starting to look rather constructive, and a big breakout could be on the way soon.
Since the peak of the Covid pandemic in 2020, the precious metal has been in a prolonged period of consolidation, fluctuating between approximately $19 to the downside and about $30 on the upside. This multi-year consolidation suggests that any eventual breakout could hold considerable significance, possibly leading the grey metal towards its 2011 all-time high of slightly below $50. However, it is uncertain whether and when such a breakout will occur, especially considering that previous surges in gold to nominal all-time highs in recent years did not prompt a corresponding rally in silver.
Still, there is a chance a potential breakout could happen soon, which means it is best to be prepared so we don’t miss out on the move. Looking at the monthly candles of silver, price is getting squeezed between two converging trend lines, which means the time of a potential breakout is nigh.
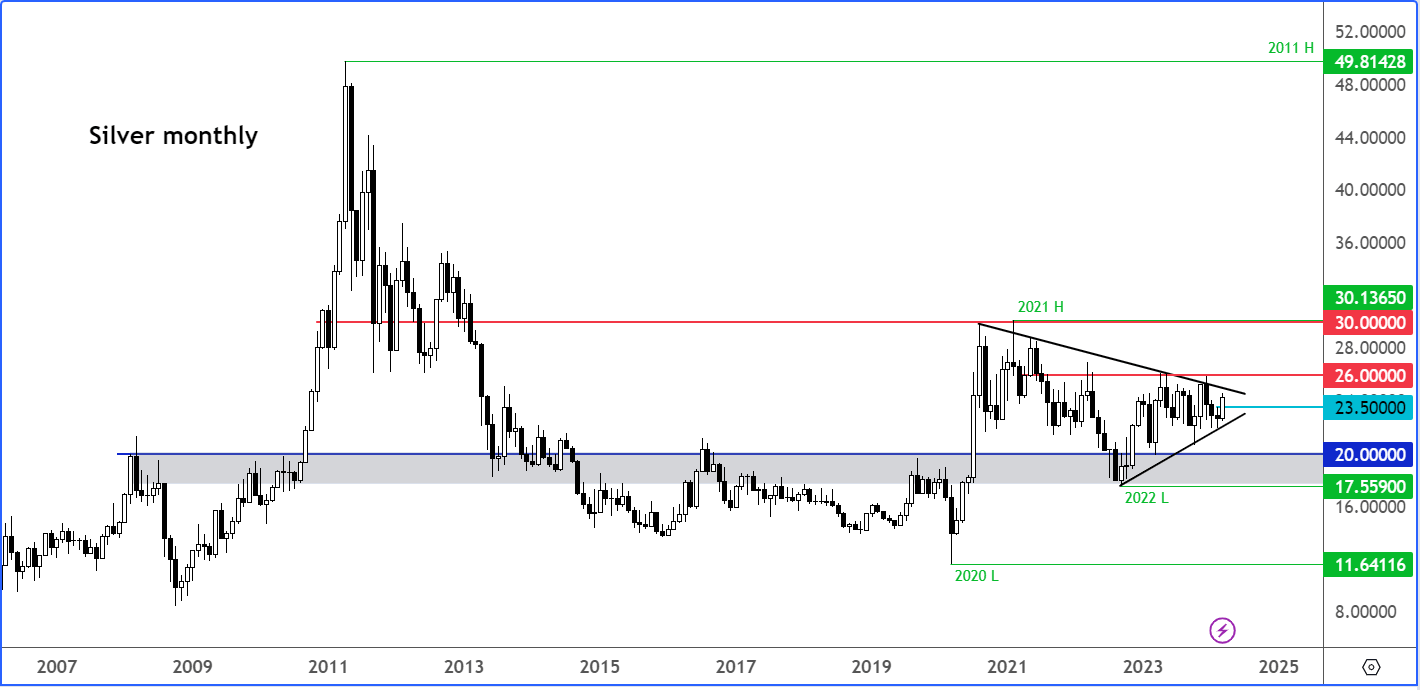
The key support level to watch is around $23.50, the high made in February. Considering the current rally of approximately +7% this month, the bulls will be keen to prevent any drop below this level. The resistance trend line of the consolidation pattern is situated around $25.00, with a slight margin of variation. Beyond this point, a horizontal resistance level near $26.00, which has proven challenging to surpass in recent years, is the next key level to watch on the upside.
Therefore, $25.00 and subsequently $26.00 are the immediate resistance levels that the bulls need to surpass to instigate an upward movement on larger timeframes. If these levels are taken out, it's plausible to anticipate silver testing its multi-year resistance around $30.00 next.
However, if support falters and silver deviates from its bullish trend, the bulls will have to wait for a fresh buy signal.
In the near term, it's vital to remain attentive to the fluctuations in short-term price action, as the journey towards $30 (or even $50) could be turbulent. So, looking at the daily time frame, we can find interim levels of support and resistance that are not easily visible on the larger time frames like the months.
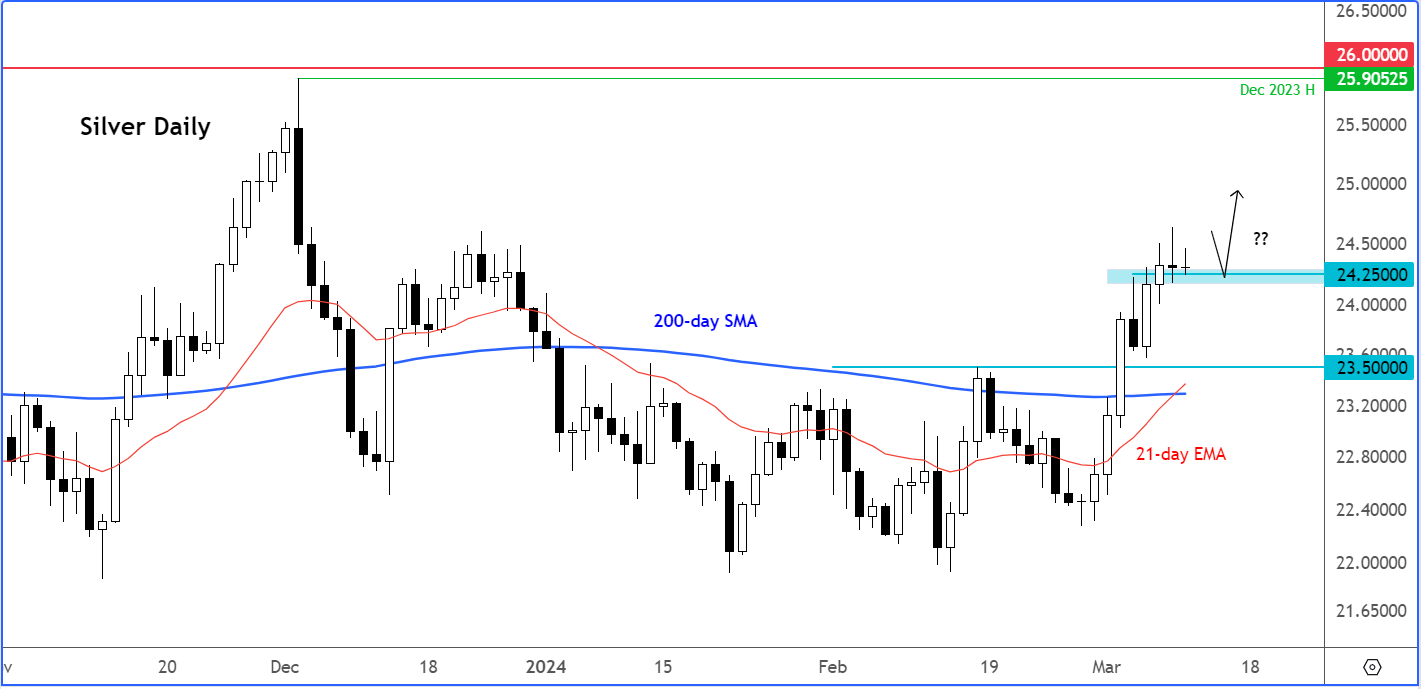
On the daily chart, you can see that silver has already broken above $23.50, which is a bullish signal. What’s more, the 21-day exponential moving average has risen above the 200-day simple average, providing an objective bullish signal.
Last week, silver formed some resistance around $24.20/5 area, but by mid-week it broke above this level and held there. Moving forward, this $24.20/5 level is now going to very important in terms of support. For as long as it holds now then the short-term path of least resistance will remain aligned with the longer-term view: to the upside. A move to probe liquidity above December’s high of $25.90 could well be underway on this time frame.
In the previous week, silver encountered resistance around the $24.20/5 area. However, it managed to surpass this level by the middle of the week and maintained its position above it. Looking ahead, this $24.20/5 level assumes significant importance as far as support is concerned. For as long as it remains intact, the short-term trajectory is likely to align with the longer-term perspective – higher.
So, all told, there's potential for silver to, at very least, test December's peak of $25.90 on this daily timeframe. But the higher time frame charts suggest there is the potential for an even larger rally.
Source for all charts used in this article: TradingView.com
-- Written by Fawad Razaqzada, Market Analyst
Follow Fawad on Twitter @Trader_F_R
How to trade with City Index
You can trade with City Index by following these four easy steps:
-
Open an account, or log in if you’re already a customer
• Open an account in the UK
• Open an account in Australia
• Open an account in Singapore
- Search for the company you want to trade in our award-winning platform
- Choose your position and size, and your stop and limit levels
- Place the trade
Latest market news
Yesterday 01:32 PM
Yesterday 09:35 AM
Yesterday 07:23 AM
Yesterday 04:48 AM
Yesterday 12:17 AM
July 25, 2024 10:39 PM
Latest Precious metals articles

Yesterday 09:35 AM
July 23, 2024 05:20 PM
July 22, 2024 03:16 PM

July 16, 2024 11:52 AM