


S&P 500 – Eyeing to retest all-time high
click to enlarge charts
Key Levels (1 to 3 weeks)
Intermediate support: 2835
Pivot (key support): 2790
Resistances: 2900 & 2959
Next support: 2730
Medium-term (1 to 3 weeks) Outlook
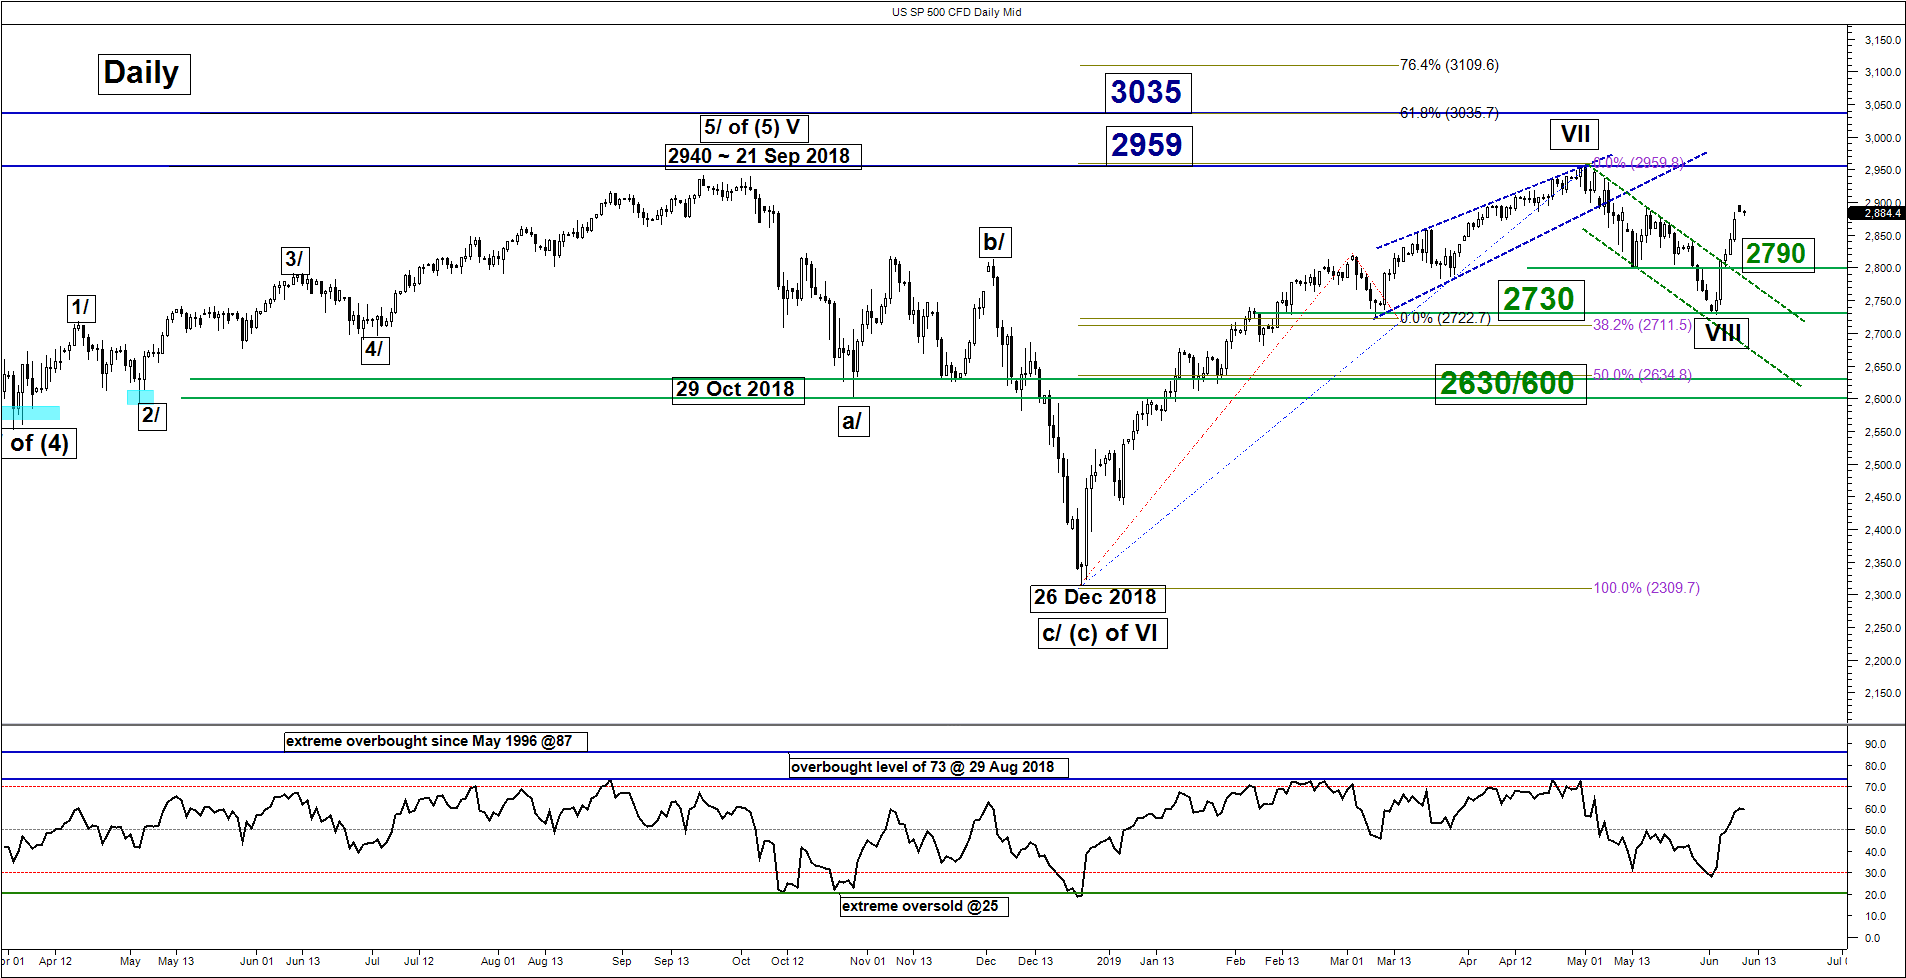
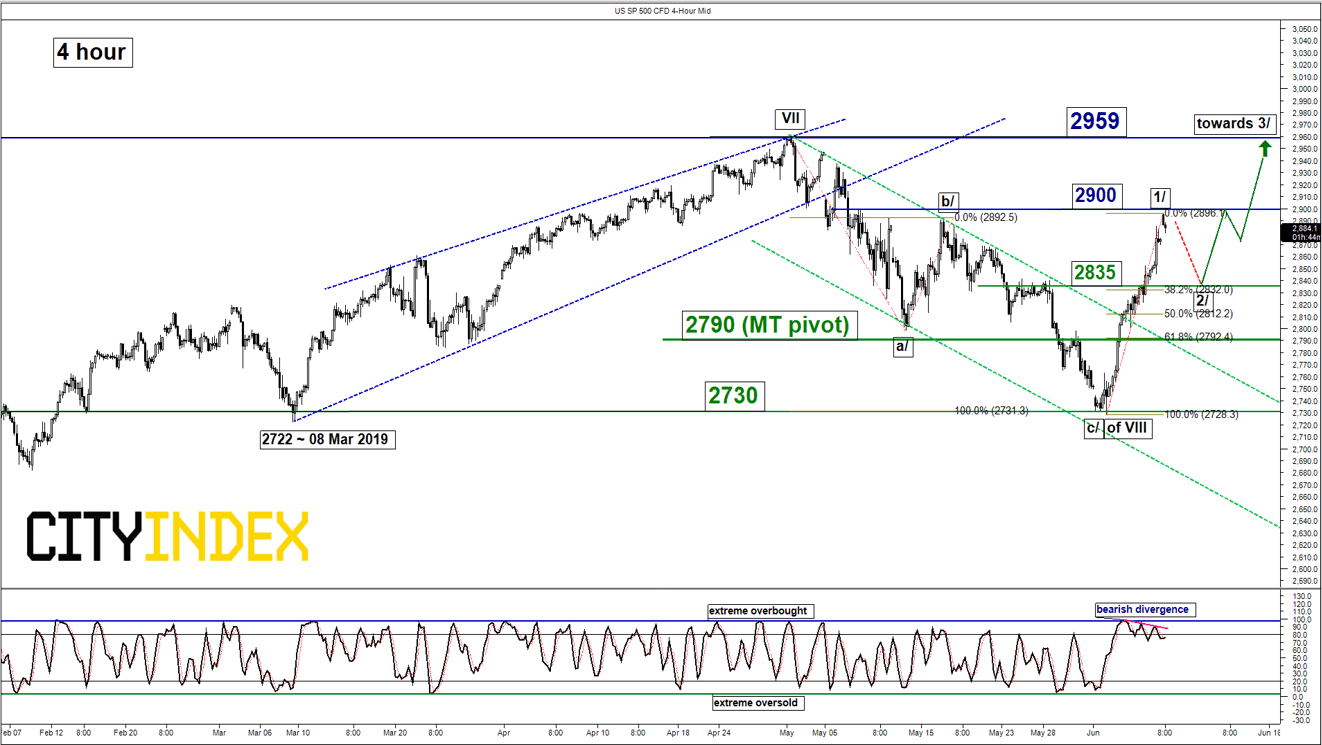
The SP 500 Index (proxy for the S&P 500 futures) had staged a decisive break above the 2802/2812 key medium-term pivotal support on 05 Jun 2019 on the back of an increasing dovish Fed. Our preferred final push down to complete the corrective down move sequence in place since 01 May 2019 had been invalidated (click here for a recap).
We sent an updated analysis on last Thurs, 06 Jun (click here for details) to turn bullish for the start of an impulsive up move sequence within a blow off phase and in today, 10 Jun Asian morning session it had almost hit the expected target/resistance at 2900 (printed a current intraday high of 2896).
Current key elements remains positive except for the risk of a minor pull-back below 2900 intermediate resistance (Elliot wave ending 5th wave target on an intermediate impulsive up move from 03 Jun 2019 low & minor swing high areas of 08/16 May 2019) coupled with a bearish divergence signal seen in the 4-hour Stochastic oscillator at its overbought region.
Expected minor pull-back target/support rests at 2832 with a maximum limit set at the 2790 key medium-term pivotal support (also the 61.8% Fibonacci retracement of the recent V-shaped rally from 03 Jun 2019 low to today, 10 Jun current intraday high of 2896).
We maintain the bullish bias in any pull-back above 2790 key medium-term pivotal support for another potential impulsive up move sequence to retest the current all-time high of 2959 in the first step.
However, a break with a daily close below 2790 negates the bullish tone for a slide to retest the next support at 2730 (08 Mar/03 Jun 2019 swing low area).
Nikkei 225 – Further rebound within long-term range
click to enlarge charts
Key Levels (1 to 3 weeks)
Intermediate support: 20900
Pivot (key support): 20800/650
Resistances: 21300, 21600 & 21900
Next support: 20185
Medium-term (1 to 3 weeks) Outlook
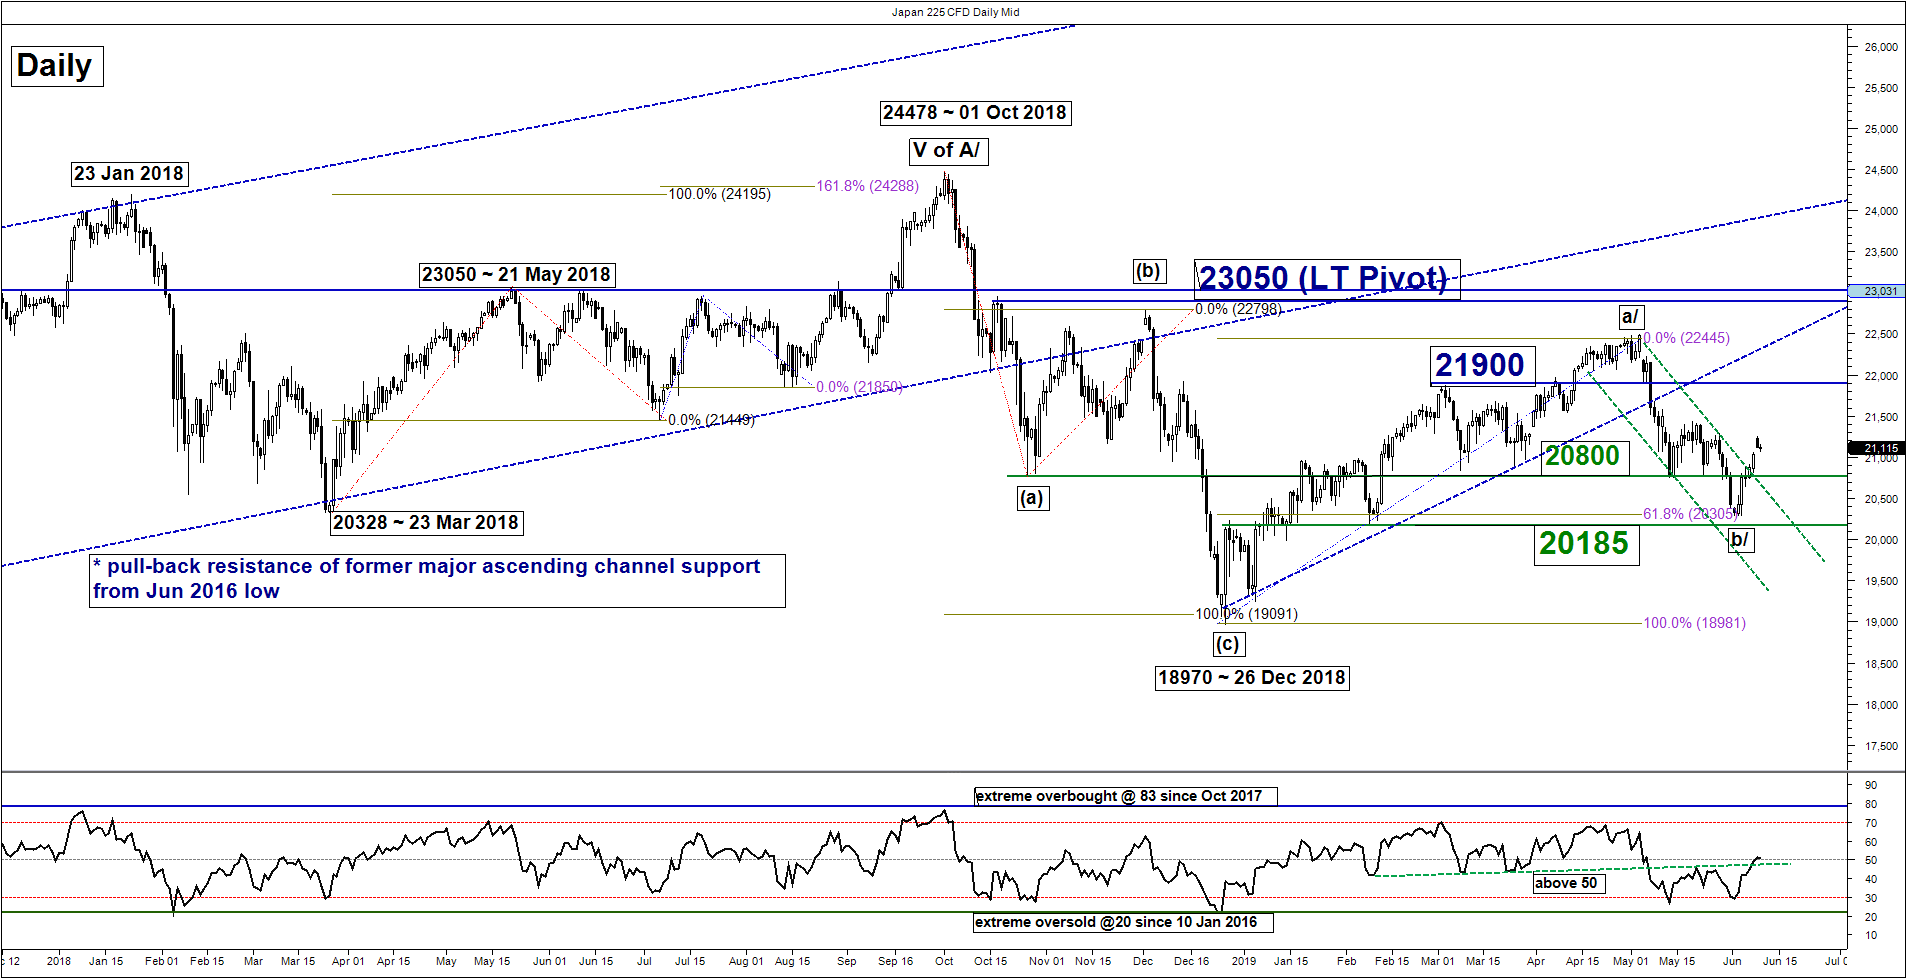
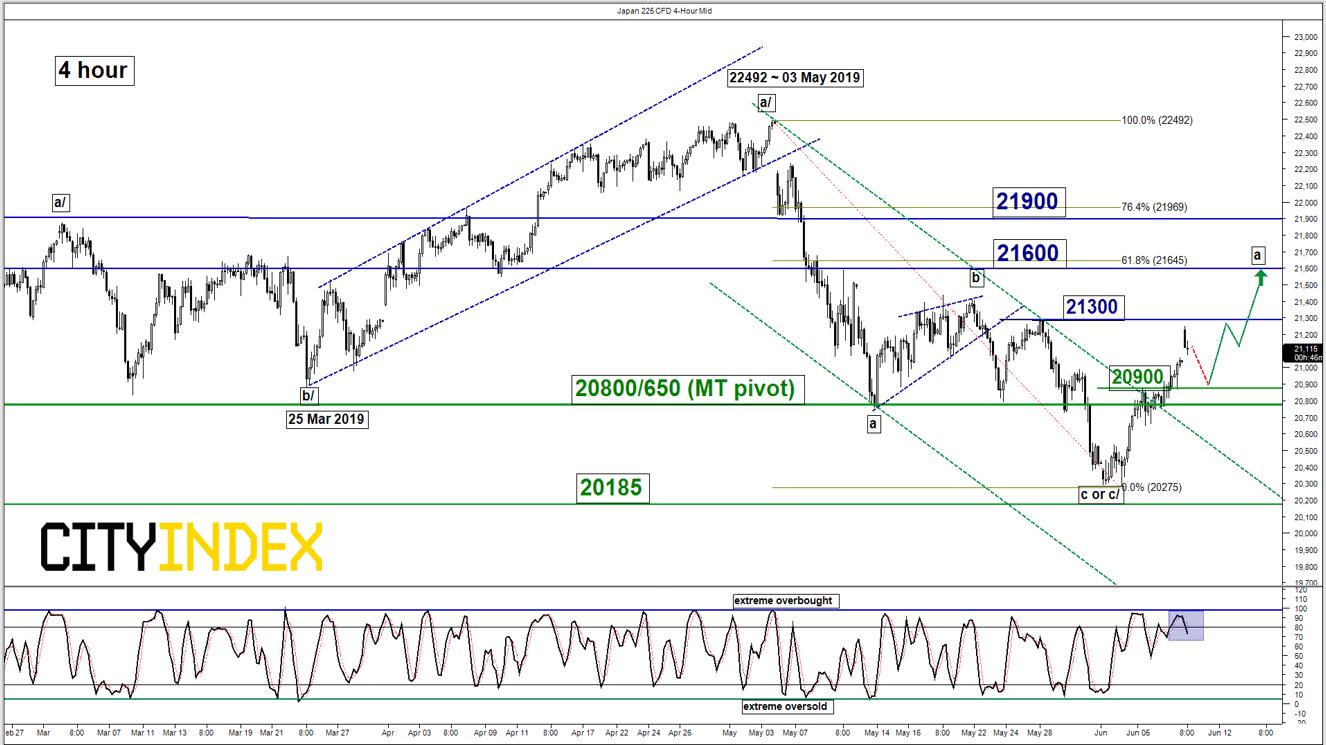
The Japan 225 Index (proxy for the Nikkei 225 futures) had broken above the 20800 key medium-term pivotal resistance as per highlighted in our previous report that invalidated the corrective down move scenario. Right now, the Index is likely shaping a further corrective rebound sequence within a complex long-term range configuration in place since 16 Oct 2018.
The Index may shape a minor pull-back first below the 21300 intermediate resistance as the 4-hour Stochastic oscillator has just exited from an overbought region with a maximum limit set at the 20800/650 key medium-term pivotal resistance. We flip to a bullish bias in any pull-back above 20800/650 for a further potential corrective rebound sequence to target the next resistance 21600 in the first step (also the 61.8% Fibonacci retracement of the recent decline from 03 May 2019 high to 04 Jun 2019 low).
However, a break with a daily close below 20650 invalidates the further corrective rebound scenario to resume the slide towards the next support at 20185.
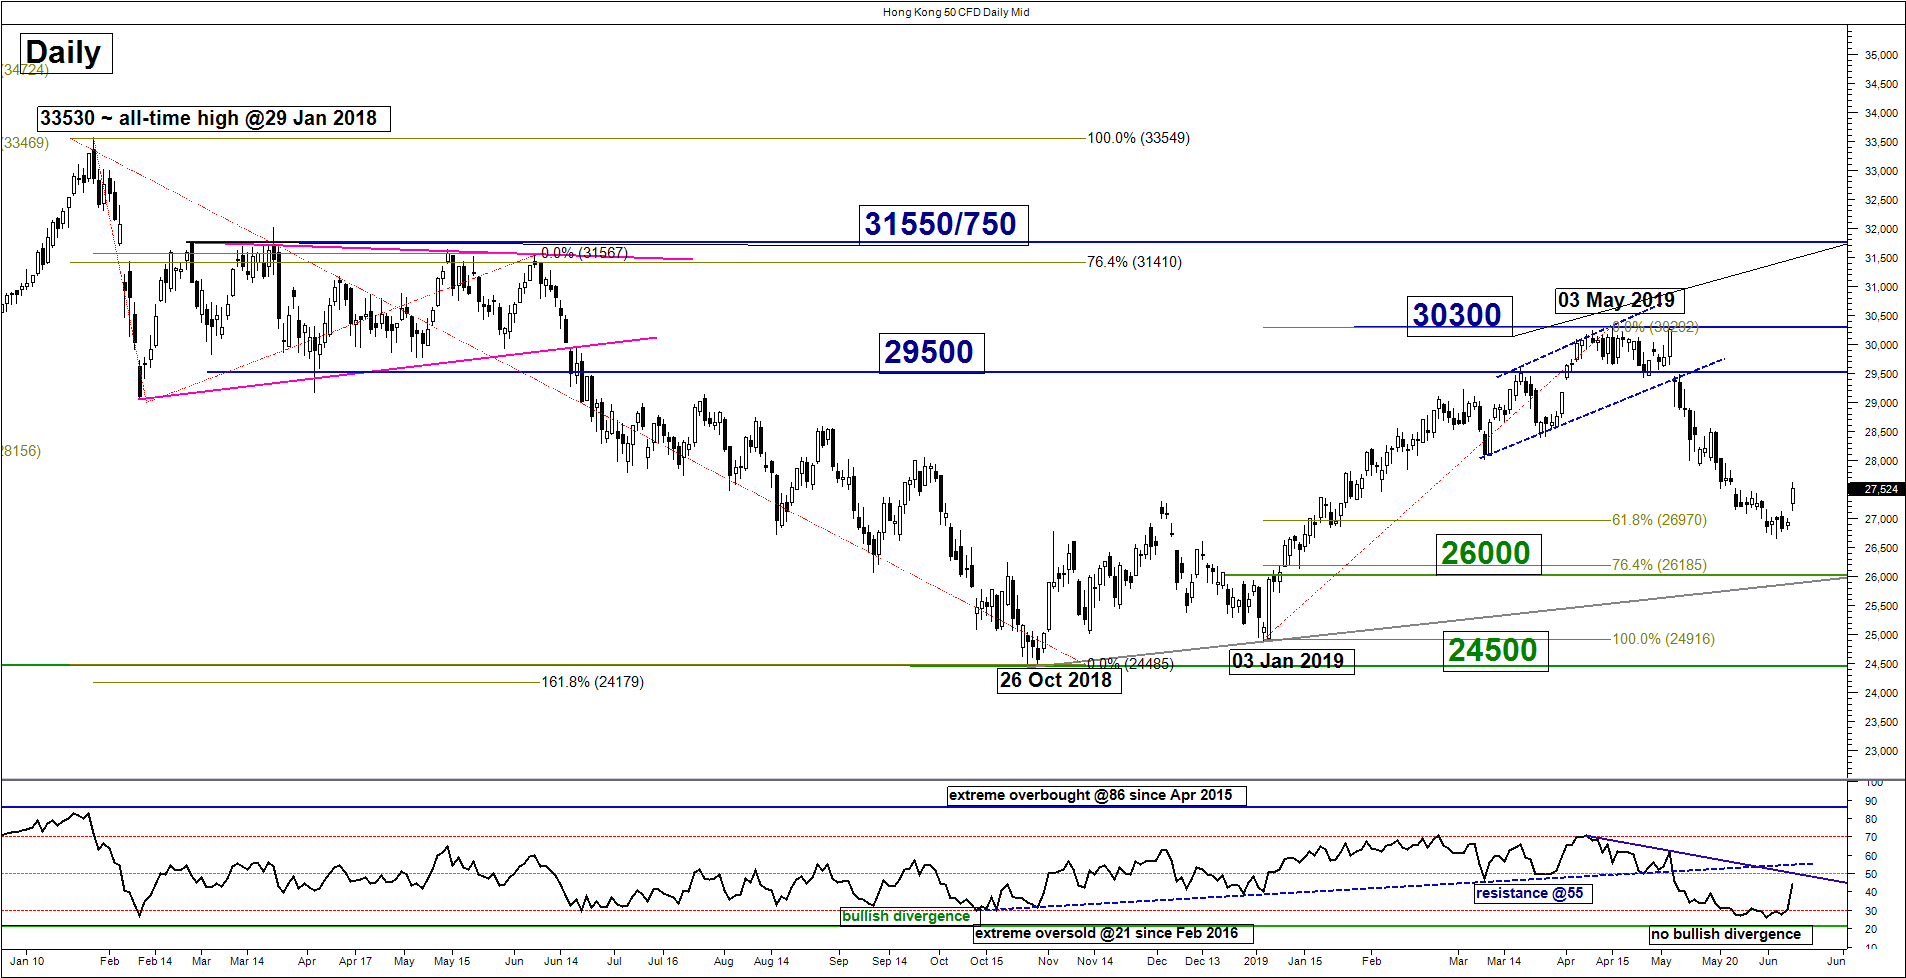
Hang Seng – Mix elements, watch 27600 & 26650
click to enlarge charts
Key Levels (1 to 3 weeks)
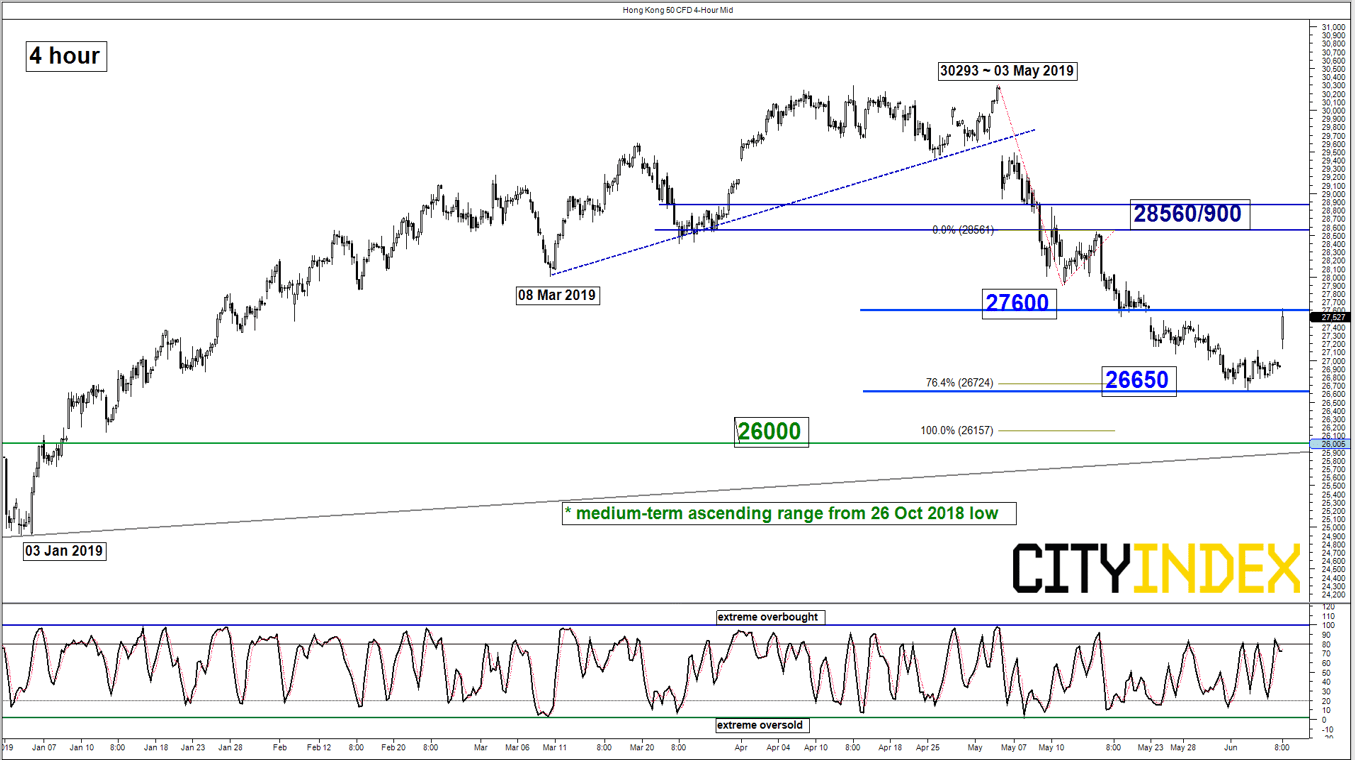
Resistances: 27600 & 28560/900
Supports: 26650 & 26000
Medium-term (1 to 3 weeks) Outlook
The Hong Kong 50 Index (proxy for Hang Seng Index futures) had staged a gap up in today, 10 Jun Asian session after closure on last Fri, 07 Jun for a public holiday in Hong Kong.
Current price action of the Index is now hovering right at the 27600 key medium-term pivotal resistance as per highlighted in our previous report with mix elements. Even though the daily RSI oscillator has exited from its oversold region, it does not shape a prior bullish divergence as compared to 26 Oct 2018 where it has shaped a bullish divergence signal that led to a significant rebound in price action of the Index. In addition, the daily RSI oscillator is now hovering right below a significant corresponding resistance at the 55 level.
Therefore, prefer to turn neutral now between 27600 and 26650. Only a daily close above 27600 validates a further up move towards the next resistance at 28560/900. On the flipside, failure to hold at 26650 sees a further slide towards the key medium-term support at 26000 (ascending range in place since 26 Oct 2018 low & Fibonacci retracement/expansion cluster).
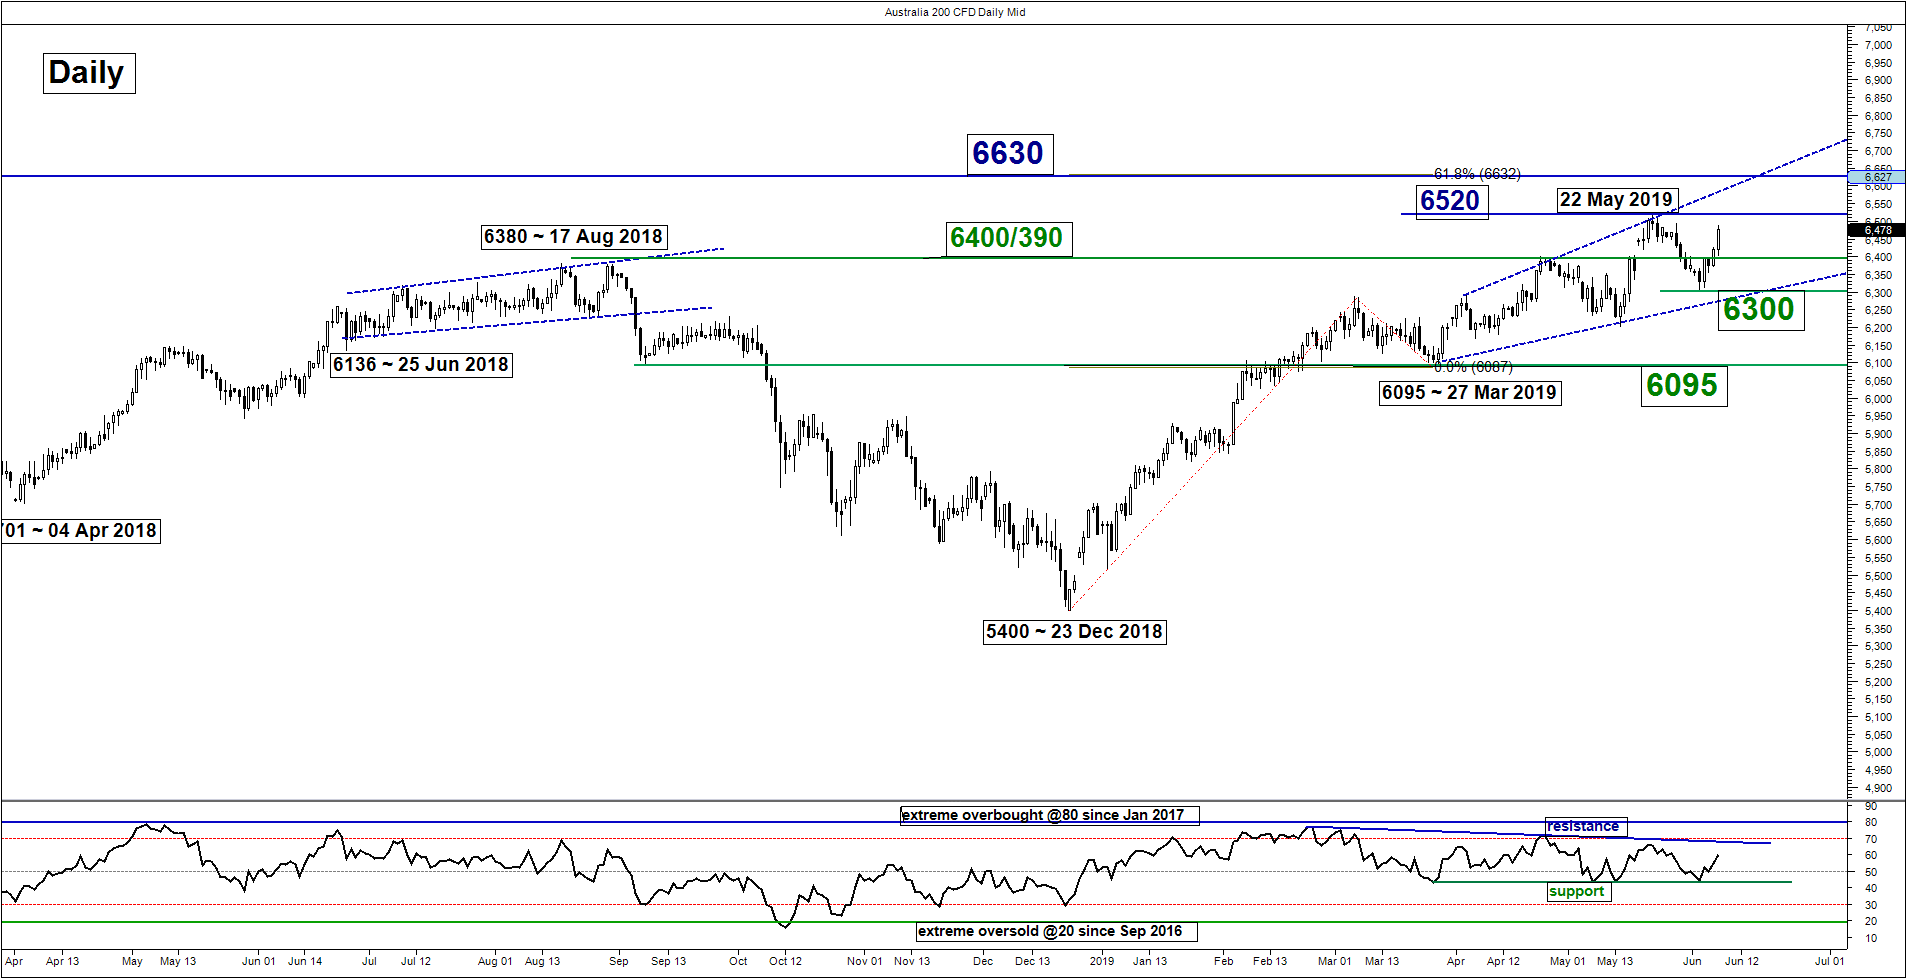
ASX 200 – Further push up towards “Expanding Wedge” resistance
click to enlarge charts
Key Levels (1 to 3 weeks)
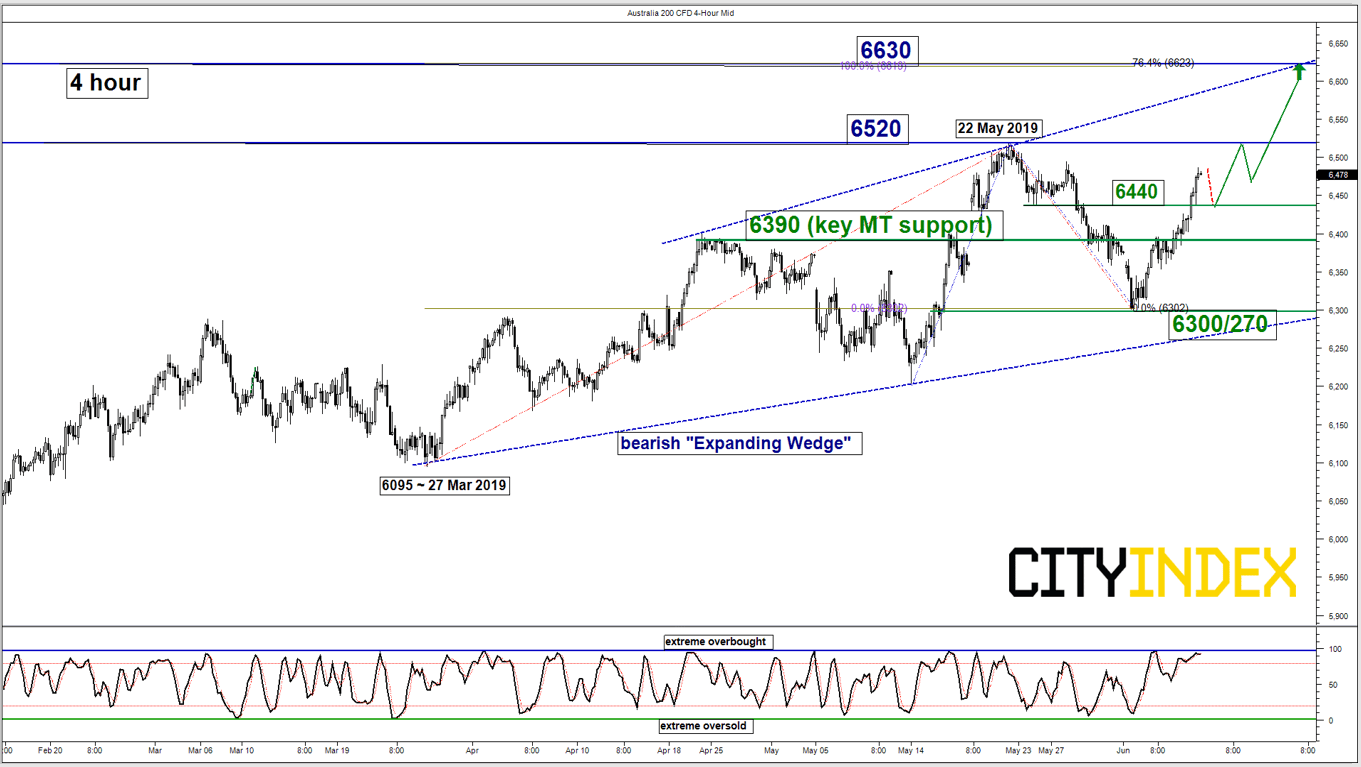
Intermediate support: 6440
Pivot (key support): 6390
Resistances: 6520 & 6630
Next support: 6300/270
Medium-term (1 to 3 weeks) Outlook
The Australia 200 Index (proxy for the ASX 200 futures) had broken above the 6450 key medium-term pivotal resistance that invalidated the push down scenario within the “Expanding Wedge” range configuration as per highlighted in our previous report.
After last week’s swift rally of 3% from the 03 May 2019 swing low area of 6300, its price action now faces the risk of a minor pull-back coupled with an extreme overbought reading seen in the 4-hour Stochastic oscillator towards the 6440 intermediate support with a maximum limit set at the 6390 key medium-term pivotal support. We flip to a bullish bias in any pull-back above 6390 for another potential upleg to retest 22 May 2019 high of 6520 before targeting the next resistance at 6630 (Fibonacci expansion cluster & upper limit of the “Expanding Wedge”).
However, a break with a daily close below 6390 invalidates the further corrective rebound scenario for a slide to retest the “Expanding Wedge” support at 6300/270.
DAX – Bears have retreated
click to enlarge charts
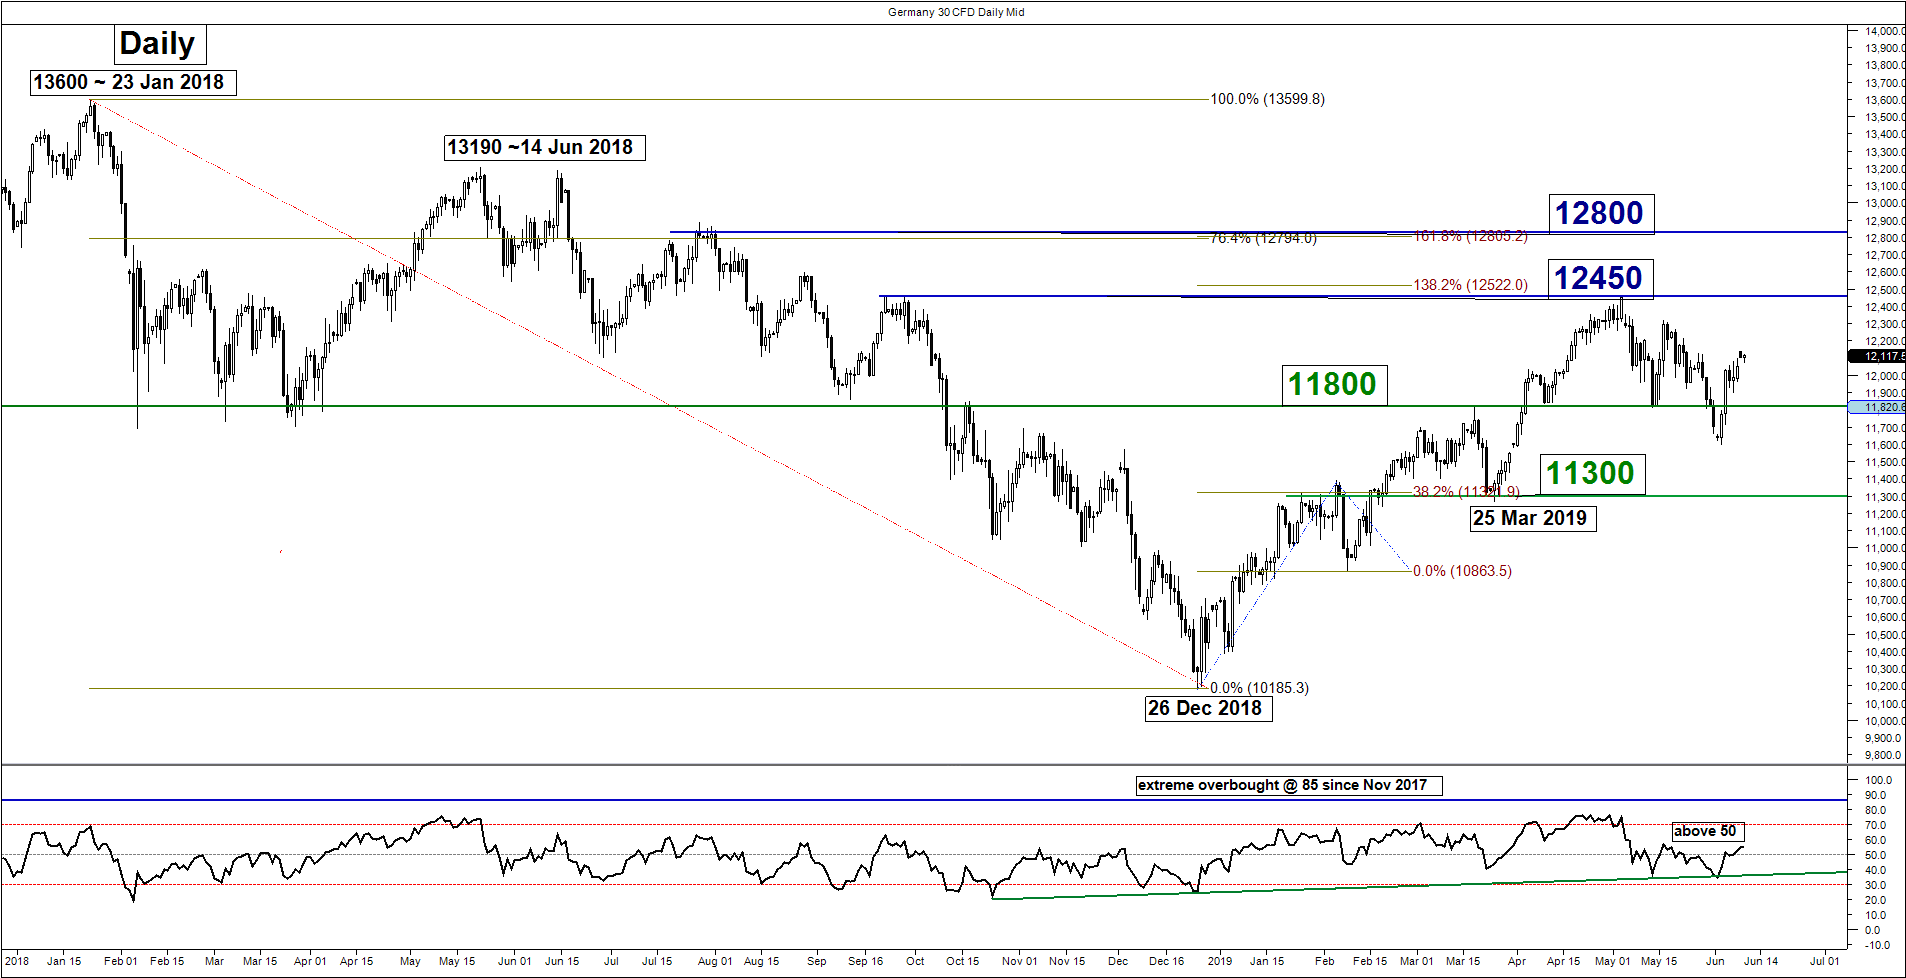
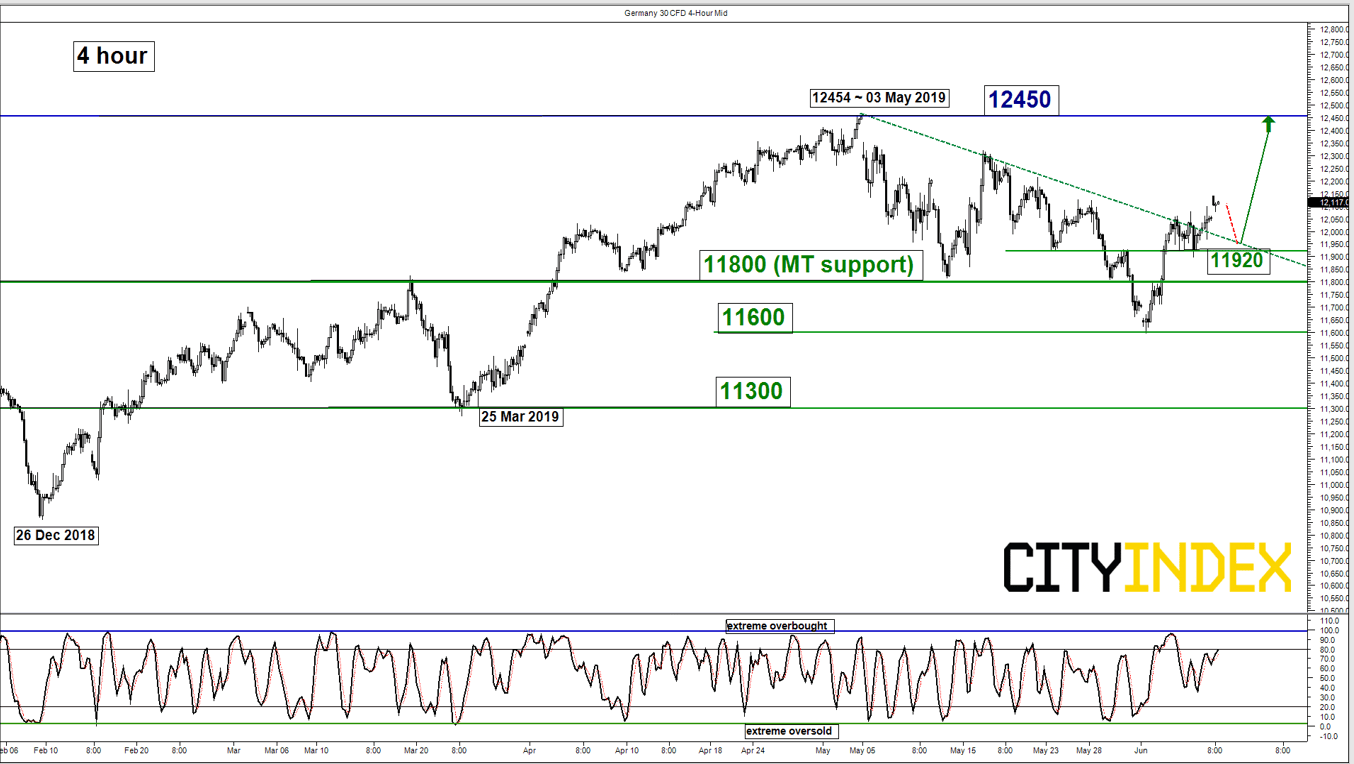
Key Levels (1 to 3 weeks)
Intermediate support: 11920
Pivot (key support): 11800
Resistance: 12450
Next supports: 11600 & 11300
Medium-term (1 to 3 weeks) Outlook
The Germany 30 Index (proxy for the DAX futures) broke above the 11940 key medium-term pivotal resistance which invalidated the corrective down move scenario as per highlighted in our previous report.
Medium-term momentum has turned positive as the daily RSI has surpassed the 50 level. We flip to a bullish bias in any pull-back above the 11800 key medium-term pivotal support for another round of potential push up to retest the 03 May 2019 swing high of 12450 in the first step.
However, a break with a daily close below 11800 negates the bullish tone for a slide back to retest 11600 (03 Jun 2019 swing low) and even the next support at 11300 (also the 50% Fibonacci retracement of the entire up move from 26 De 2018 low to 03 May 2019 high).
Charts are from City Index Advantage TraderPro
Latest market news
Yesterday 03:00 PM
Yesterday 01:12 PM
Yesterday 11:14 AM
Latest Indices articles

Yesterday 03:00 PM
April 24, 2024 03:30 PM
April 18, 2024 04:46 PM