

Currency markets essentially saw a slight extension of Wednesday’s US CPI moves, with the US dollar index initially rising a smidgen before essentially closing flat to form a doji. AUD/USD, NZD/USD and GBP/USD were the only FX majors to rise slightly on the day, but all in all volatility was limited despite and ECB meeting, US PPI data and several Fed members speaking.
Fed members are in no rush to cut interest rates with Williams saying “there’s no clear need ot adjust monetary policy in the near term”, Collins now thinks it “may take more time than I previously thought” to gain confidence on lower inflation. Markets shrugged off the higher-than-expected PPI at 2.4%y/y (2.3% expected and prior upgraded to 2.1%), although core PPI was flat at 0.2% m/m and PPI softened to 2.1% y/y and 0.2% m/m.
The ECB hinted at a June cut despite the Fed’s pushback on a similar move. ECB President Lagarde said it “would be appropriate” to ease in June if a fresh assessment of data provided confidence to do so.
EUR/USD initially broke beneath the December low to have a crack at the February low, before reverting to just back above the original breakout level. Ultimately the bias is for the US dollar to eventually rise to 106 and EUR/USD fall beneath the February low, but for now a period of consolidation or retracement could be due. DAX futures failed to see any merit or perform any bounce, instead falling towards the support zone around 1800 highlighted yesterday. I suspect this zone may provide better support over the near term.
Gold reached a fresh record high, US yields were a few basis points lower at the short-end although the 5-year and above rose between 1-4 bp.

BOJ officials may be softening their stance towards intervention, with MOF financial minster Suzuki saying that “a weak yen has merits, demerits”. USD/JPY close above 153 for the first time since June 1990 on Thursday.
The IMF see inflation falling in 2024, although admit that the fight against in inflation is not over. And coming from the IMF, it further adds to my concerns that inflation could actually rise this year given the recent surge of commodity prices. Should supply chains get disturbed once again, we’d have the perfect catalyst for another round of inflation and that will certainly make things difficult for central banks that are teasing markets with potential cuts.
Economic events (times in AEST)
- 08:30 – New Zealand Business PMI
- 08:45 – New Zealand retail sales, food price index
- 13:00 – China trade balance
- 14:30 – Japan capacity utilisation
- 16:00 – UK GDP, industrial production, manufacturing production, construction output, trade balance
- 16:00 – Germany CPI
- 16:45 – France CPI
- 17:00 – Spanish
- 18:00 – ECB forecast
- 19:00 – China outstanding loans, total social financing
- 21:00 – ECB’s Elderson speaks
- 22:30 – US import/export prices
- 00:00 – US consumer sentiment, inflation expectations (Michigan University)
USD/JPY technical analysis (daily chart):
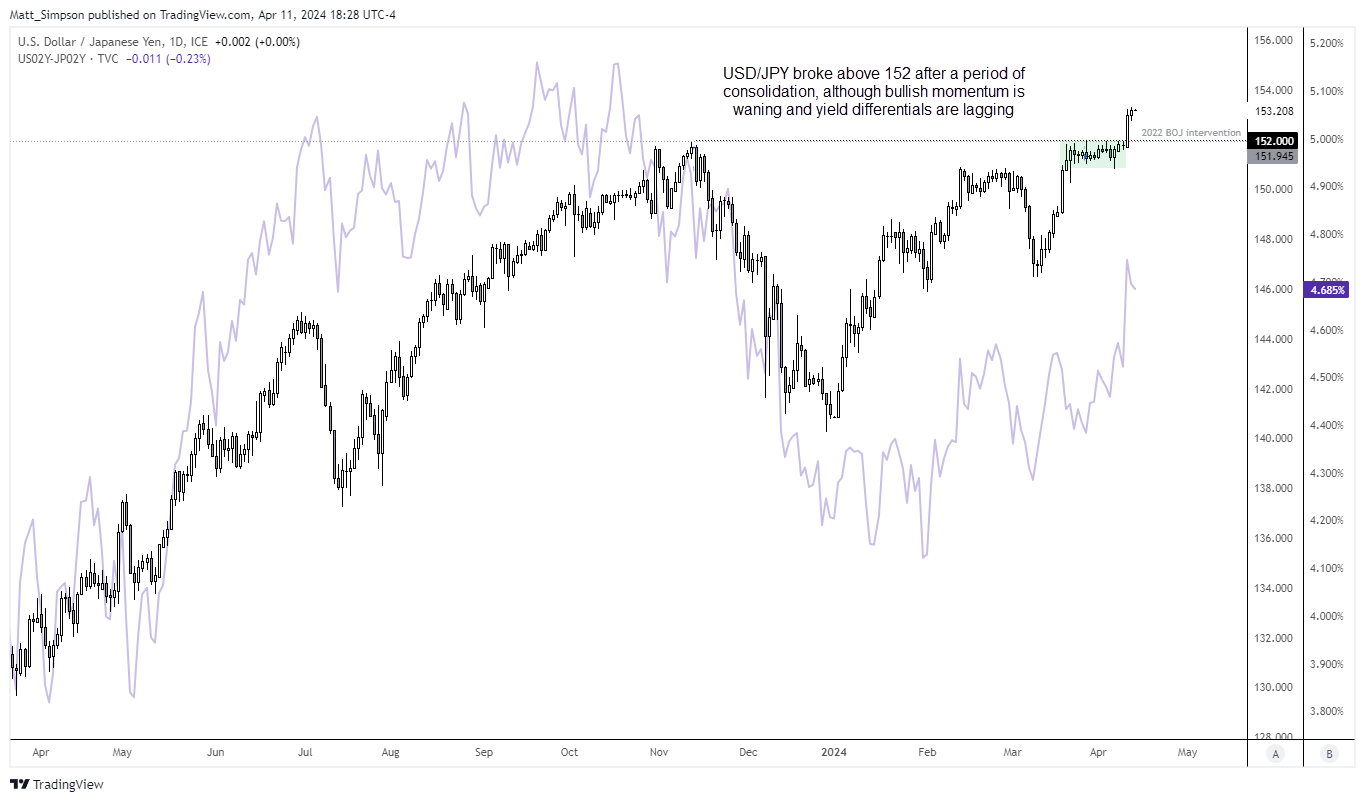
US inflation saw USD/JPY burst through its glass ceiling of 152 on Wednesday, a level it had been hesitant to even touch in fear of BOJ intervention. Yet Wednesday’s hot CPI report proved to tempting for bulls to take action, and so far there seems to be no consequence. In fact yesterday’s comments from the MOF suggest they may be taking a lighter view over any action, which saw USD/JPY march higher and close above 153 for the first time since June 1990.
The daily chart shows a clear break of resistance after a period of consolidation. And if the MOF and BOJ lay off verbal intervention, market have little choice but to bid USD/JPY given the vast yield differential between the BOJ and Fed rates (and prospects of ‘higher for longer’ in the US). Yet bulls may want to remember that market positioning is just off a record high level of net-short exposure to suggest a sentiment extreme. Furthermore, the US-JP 2-year yield differential is not fully backing up the latest surge USD/JPY, as the spread remains beneath its November high (whereas USD/JPY is at a 34year high). Therefore, whilst the trend points higher, bulls may want to tread carefully and seek near-term setups only.
USD/JPY technical analysis (1-hour chart):
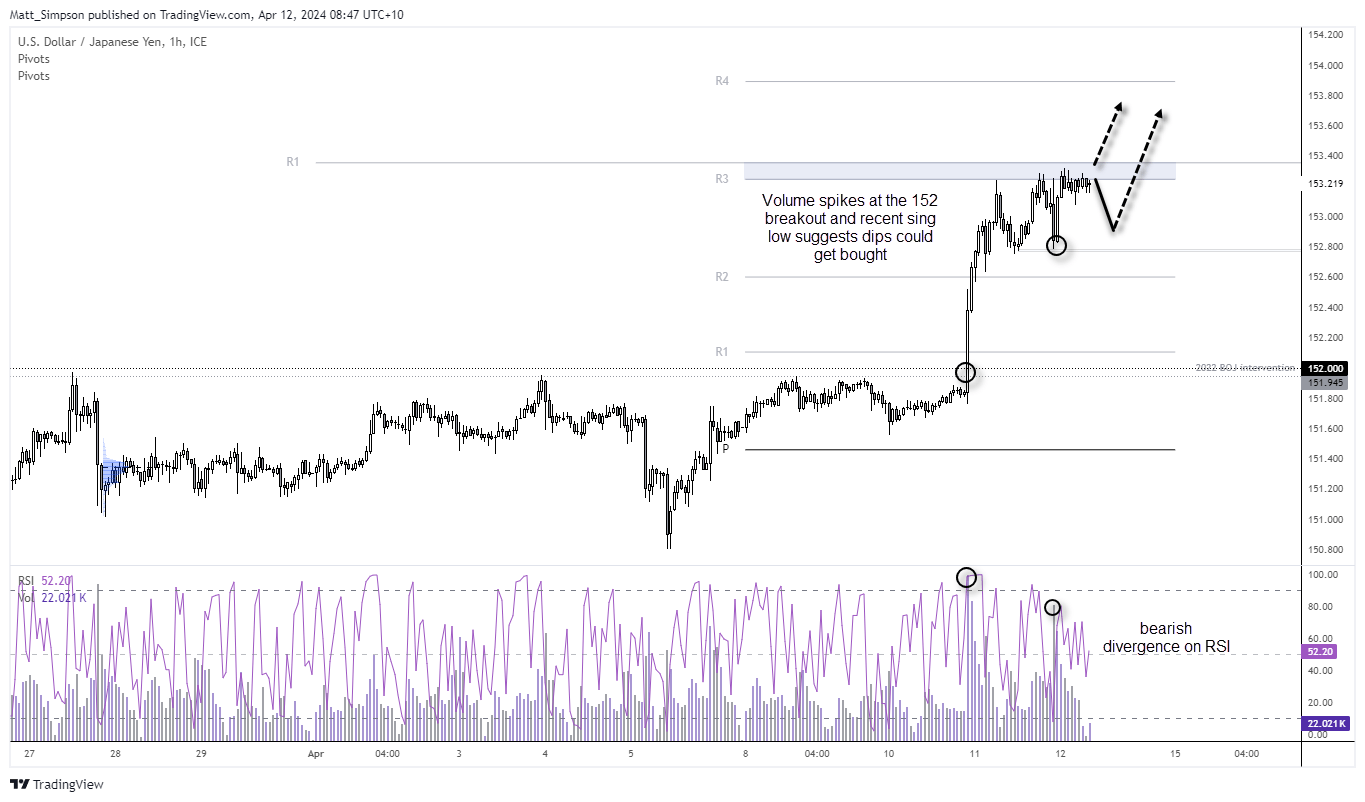
The 1-hour chart shows that resistance has been met around the weekly R3 and monthly R1 pivot point. A bearish divergence is also forming on with the RSI, so perhaps we’ll see a pullback from current levels ahead of its next leg higher.
Yet as there are large volume spikes around the initial breakout and recent swing low around 152.80, dips seem more likely to be bought (unless we do get stronger clues from Japan’s officials about potential intervention). In which case, 152 at a minimum comes into focus for bears, a break beneath which opens up the floor for a deeper correction.
View the full economic calendar
-- Written by Matt Simpson
Follow Matt on Twitter @cLeverEdge
How to trade with City Index
You can trade with City Index by following these four easy steps:
-
Open an account, or log in if you’re already a customer
• Open an account in the UK
• Open an account in Australia
• Open an account in Singapore
- Search for the market you want to trade in our award-winning platform
- Choose your position and size, and your stop and limit levels
- Place the trade
Latest market news
Yesterday 01:32 PM
Yesterday 09:35 AM
Yesterday 07:23 AM
Yesterday 04:48 AM
Yesterday 12:17 AM
July 25, 2024 10:39 PM
Latest Asian Open articles

July 25, 2024 10:39 PM

July 24, 2024 10:10 PM

July 23, 2024 11:29 PM

July 22, 2024 10:43 PM