
The spinning top candlestick pattern appears regularly across trading charts and is usually very easy to spot – making it a popular tool among technical traders. Learn how to trade spinning tops here.
- What is a spinning top candlestick?
- What does a spinning top mean?
- How to trade spinning tops
- Start trading spinning tops
- Spinning top example
What is a spinning top candlestick?
A spinning top candlestick is a chart pattern that forms over a single session. It features a short body with long upper and lower wicks on either side of it, meaning that the market rose high and dropped low over the session – but ended up right next to where it started.
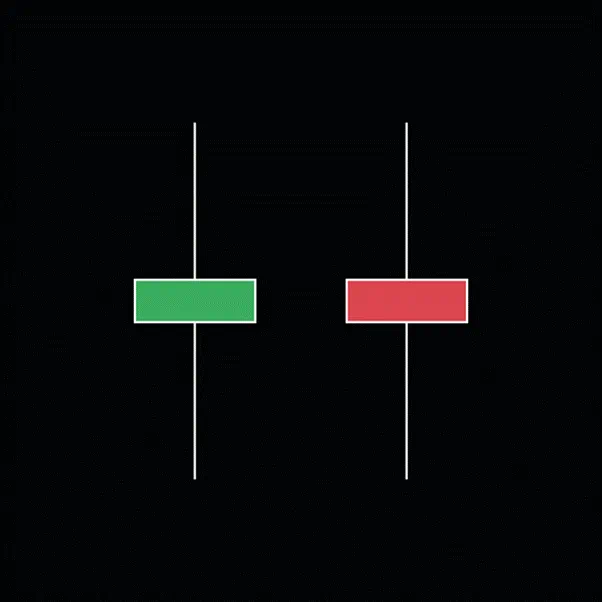
A spinning top is a fairly easy candlestick pattern to spot. Essentially, it looks just like a long-legged doji. The only difference between the two is that a spinning top has a short body, whereas a long-legged doji has no body whatsoever.
Learn more about how to read candlestick charts.
What does a spinning top candlestick mean?
A spinning top candlestick means that a market has reached a point of indecision. Within the period, bulls sent the price up high, and bears sent it down low – but neither was able to maintain that momentum by the session’s end.
Spinning tops are often categorised into bullish and bearish variants, depending on the colour of the candlestick:
- Bullish spinning top candlesticks are green, indicating that the market closed higher than it opened
- Bearish spinning top candlesticks are red, meaning the market closed lower than it opened
In truth, though, the colour of the stick isn’t that important – while it can mean a stronger signal, both mean that bulls and bears are cancelling each other out.
How to trade a spinning top chart pattern
How you trade a spinning top candlestick depends entirely on the context it arrives in. On their own, spinning tops don’t necessarily tell you that much – only that there’s an ongoing battle between buying and selling sentiment. But in context, they can offer useful signals.
A spinning top that lands during a strongly trending market, for example, can indicate a future reversal. Why? Because while bulls or bears were firmly in control of the market during its trend, they are now facing opposition – a sign that sentiment may be on the wane.
On the other hand, if you spot a spinning top on a rangebound market it can signal a continuation of the consolidation. After all, neither buyers nor sellers currently have the upper hand.
But even in context spinning tops don’t necessarily offer a strong signal of upcoming movement. Many traders use them in conjunction with other tools and indicators for a more comprehensive picture of momentum. A spinning top that lands on a Fibonacci retracement level, for instance, can make it much more likely that the market is about to reverse.
Confirming spinning top patterns
Whatever spinning top strategy you employ, a key rule to follow is to always wait at least one session before opening your position. Remember, a spinning top only ever tells you that bulls and bears are cancelling each other out – which side is going to win out remains to be seen.
Because of this, most traders hold off confirming what the market might do next. For example, if a spinning top appears in a strong uptrend, they might wait to confirm that a reversal is underway before they open a position.
Spinning top price targets and stop loss levels
One difficult aspect of spinning tops is that, unlike other chart patterns, they don’t necessarily offer much insight into where to place your stop loss and take profit.
Some traders use the boundary of the wicks to place their stop – at the top of the upper wick for a short trade, and the bottom of the lower wick for a long one. But depending on the formation of the pattern this can be too restrictive or mean taking on too much risk.
As we’ve already covered, though, spinning tops are best used alongside other patterns and indicators – so you might want to look elsewhere for your trade parameters, too.
Starting trading spinning top patterns
Follow these steps to start trading technical patterns with City Index today:
- Open your City Index account, or log in if you already have one
- Add some funds
- Look for spinning top candlesticks using our advanced technical analysis tools
- Open your buy or sell position
Alternatively, you can practise trading with a cost-free City Index demo account. You’ll get full access to our platform, preloaded with virtual funds. So, you can test out your trading strategy with zero risk.
Double spinning top candlestick
Sometimes when trading, you might see a market form two spinning tops in a row. This is an even stronger signal that buyers and sellers are cancelling each other out, as it means that the same price action occurred in the second session as the first – buyers sent the market high, sellers sent it low but neither could keep that momentum by the end of the session.
Trading a double spinning top can be difficult as there is no overriding momentum in either direction. Much as we outline above, you’re often better off waiting a few sessions to see where the market might head next.
Spinning top candlestick example
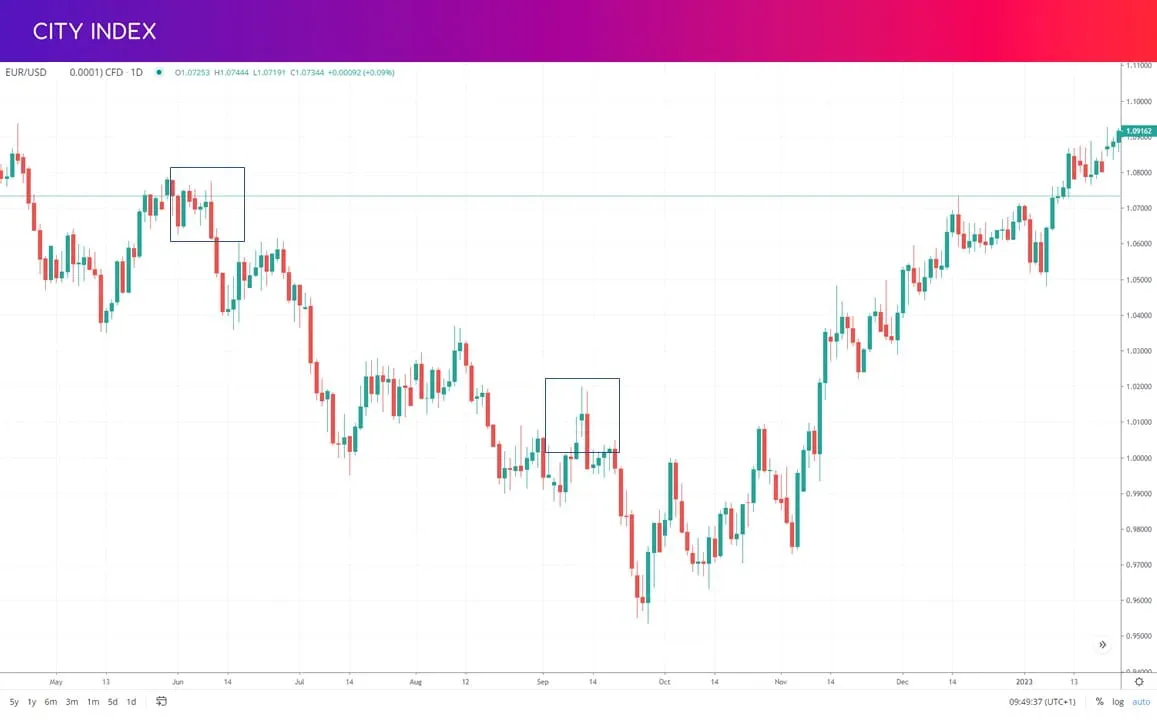
Here, we can see a EUR/USD daily chart with a few spinning tops on it – but we’ve highlighted two.
The first arrives after a period of consolidation following an uptrend to 1.0730 and marks the beginning of a new decline all the way down to 1.0400. While the potential to capture over 300 points of profit is enticing, this spinning top illustrates the difficulty of trading the pattern – before the downtrend takes hold, there’s little indication of which way the market might break.
The second lands at the peak of a brief countertrend against the prevailing bear market, and sees Eurodollar begin falling once more from 1.0100 to a new low below 0.9600.
This time around, there are a few clues that the downtrend is about to kick off. First of all, the spinning top forms during a clear uptrend, indicating a possible shift of momentum. And for the second clue, we can apply the Fibonacci retracement tool to the chart:
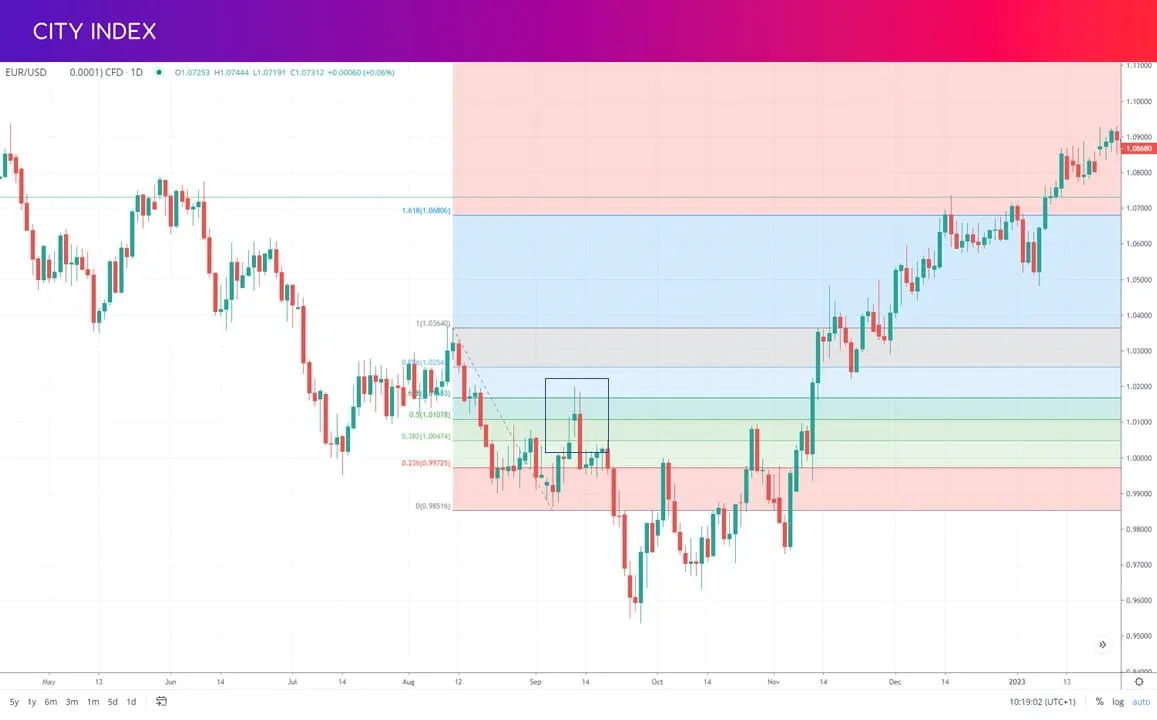
As we can see, the spinning top candlestick appears at the key Fib level of 50% – giving further strength to the bearish signal.
Spinning top candlestick summary
- Spinning tops are a pattern that’s formed of a single candlestick
- The candle has a short body and long wicks on both sides, giving it the appearance of a spinning top
- Spinning tops resemble long-legged doji, except they have a wider body and are much more common
- They indicate that sentiment is split between buyers and sellers, with neither side in control
- The pattern can signal impending reversals when it appears as part of a trend or a continuation when it appears in a rangebound market
- Spinning tops are best used alongside other indicators and tools, as they don’t provide a strong signal on their own
- You can trade spinning tops with a City Index account, or try out trading them risk free with a demo account
Latest market news
Yesterday 01:32 PM
Yesterday 09:35 AM
Yesterday 07:23 AM
Yesterday 04:48 AM
Yesterday 12:17 AM
July 25, 2024 10:39 PM
Latest Financial market insight articles

March 26, 2024 04:11 AM

February 24, 2024 05:10 PM
November 16, 2023 10:23 AM