January 5, 2021 3:11 PM
OPEC+ cut strengthening crude and correlated currencies: WTI, USD/CAD, USD/NOK
As the OPEC meeting concluded today, Russia said they would slightly increase production in Crude Oil. However, as my colleague Matt Weller points out, Saudi Arabia agreed to cut 1,000,000 bpd, for a net cut of 900,000 bpd for the next 2 months! The result is a new post-pandemic high above $50 for February WTI crude futures, up nearly 5% today alone! However, crude oil isn’t the asset to move on the news, the Canadian Dollar and Norwegian Krone have gone bid as well!
WTI
February Crude Futures traded as high as $50.17 today, after breaking through horizontal resistance at $49.80 and psychological resistance at $50.00. A daily close above $50 could open the way for a sustained move up to February 20th highs at $54.66. However, notice that the RSI is diverging with price. This is an indication that price may be ready to pull back before continuing higher. Keep note of the $49.80/$50.00 area. Above this area bulls are in control, while below, bears take control. Support on the daily is at the December 23rd lows of $46.16.
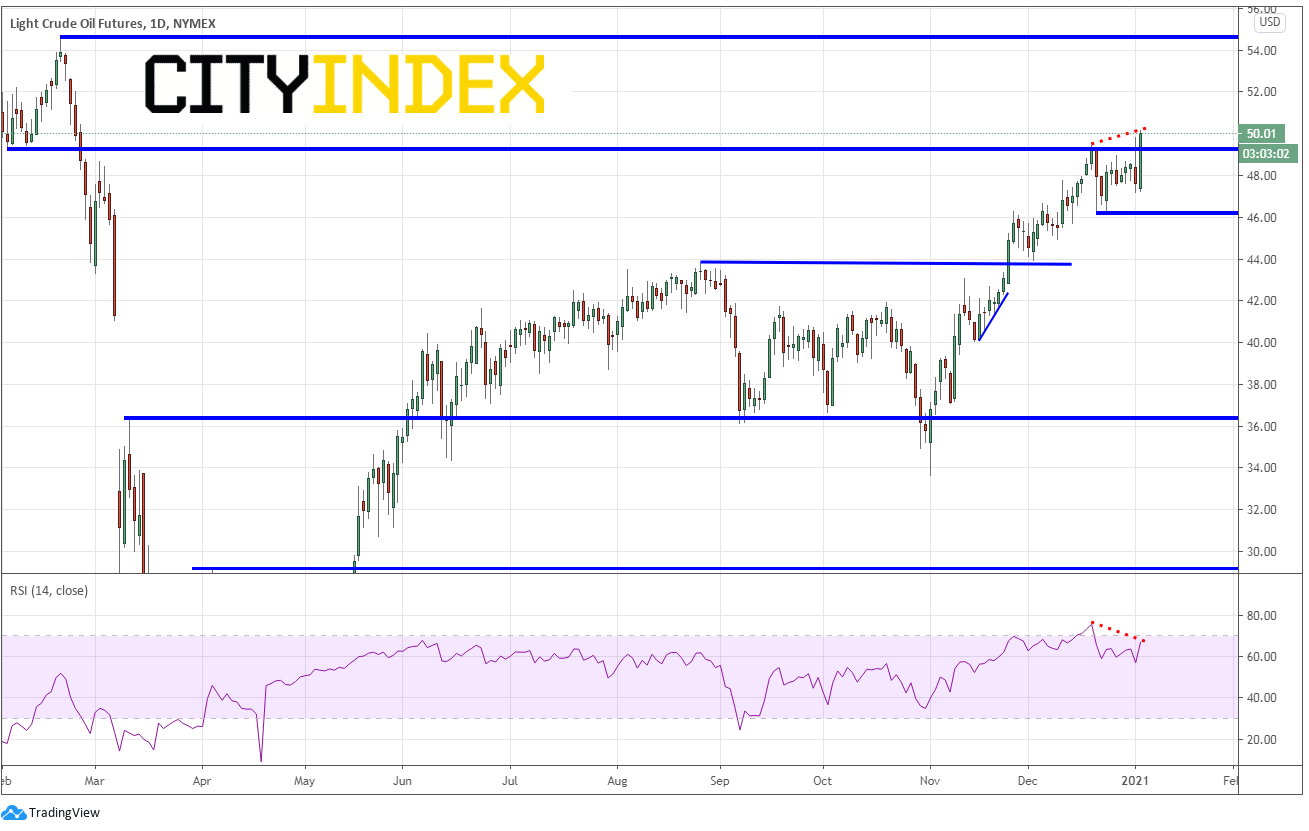
Source: Tradingview, City Index
As we mentioned in Monday’s Currency pair of the week, USD/CAD has been highly correlated with Crude Oil since the March lows. As crude has been moving higher since then, USD/CAD has been moving lower. (Crude oil and USD/CAD are inversely correlated). After yesterday’s move higher in USD/CAD it appeared that the pair may hold horizontal support and the 161.8% Fibonacci extension from the September 1st lows to the late September highs near 1.2707. However, with crude oil higher today, USD/CAD fell from 1.2791 down to 1.2658. The next level of support isn’t until April 2018 lows near 1.2544. As with the RSI in Crude Oil, it is diverging with price in the daily timeframe. Therefore, USD/CAD could bounce back to 1.2707 before resuming its trend lower.
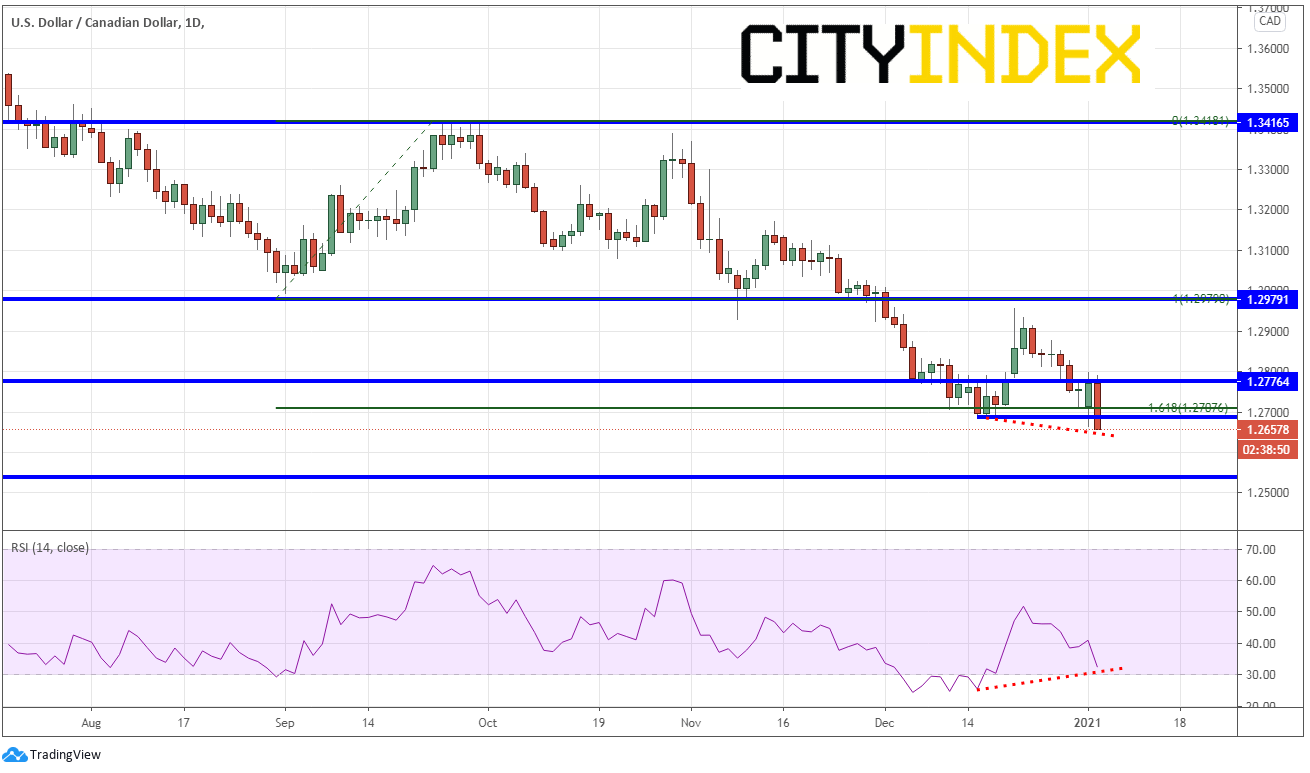
Source: Tradingview, City Index
As a crude export led economy, Norway’s Krone often acts in a similar manner as the Canadian Dollar when it comes to crude oil. Just as with USD/CAD, USD/NOK has been moving lower since its March pandemic highs. On Monday, the pair broke below its December 17th of 8.5507 and is currently testing horizontal support and the 127.2% Fibonacci extension from the September 1st low to the late September highs (as time frame as USD/CAD) near 8.4105. USD/NOK is currently forming a descending wedge on a daily timeframe. If price breaks out to the topside of the wedge, the target is a 100% retracement , which is 8.7636. However, there is long-term resistance just ahead of that at 8.6700. There is also a resistance zone further above between 8.9098 and 9.0114. Note that the RSI is also diverging with price on the daily timeframe, indicating the possibility of a short-term bounce. Support below is at the 161.8% Fibonacci extension from the previously mentioned time frame and horizontal support from September 2018 near 8.0805.
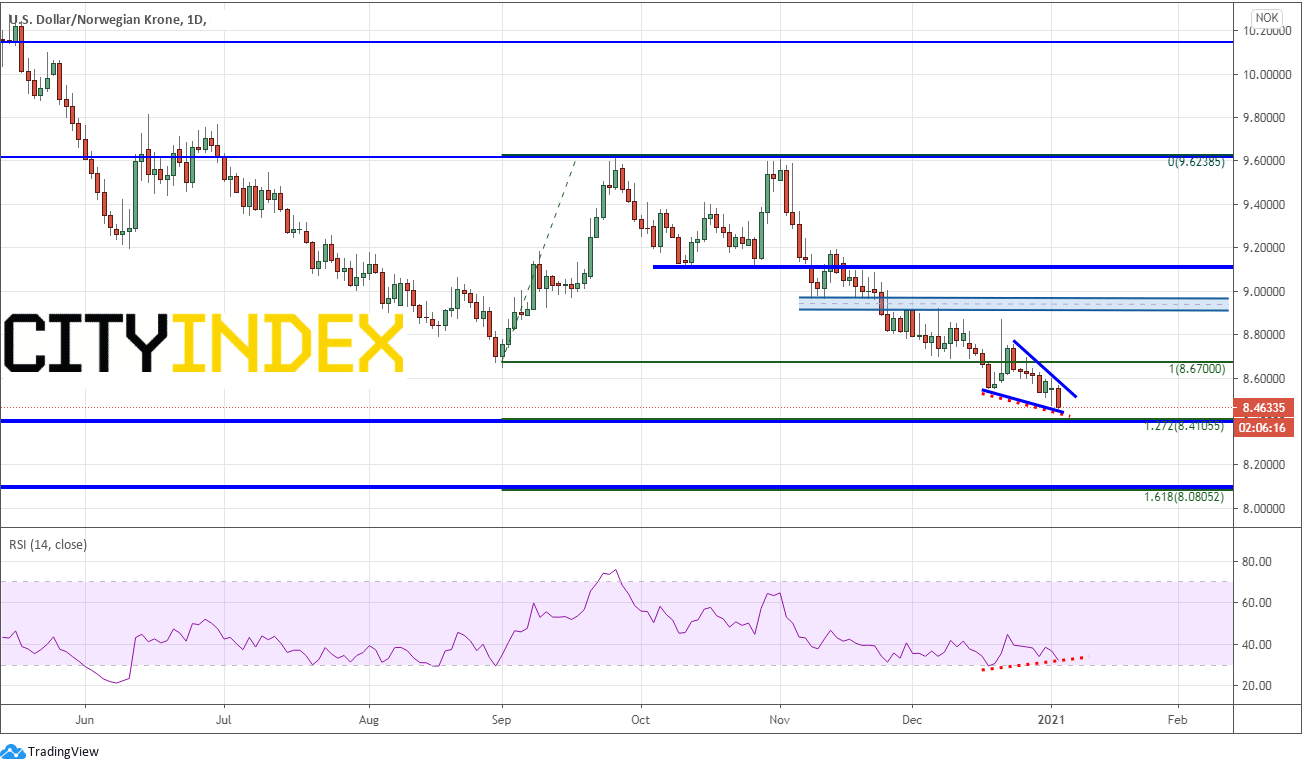
Source: Tradingview, City Index
The $49.80/$50 level in Crude Oil must be watched! Above it, the bulls should be in control, while below it, bears may have their way. However, whichever way it moves, it will affect both USD/CAD and USD/NOK!
Learn more about forex trading opportunities.
Learn more about oil trading opportunities.
Latest market news
Yesterday 10:44 PM
Yesterday 05:00 PM
Yesterday 03:13 PM
Latest Crude Oil articles


April 28, 2024 02:00 PM
April 22, 2024 04:00 PM
April 19, 2024 03:35 AM