

- Nasdaq 100 analysis: investors consider key risks facing stocks
- Core PCE inflation coming up, with FOMC and NFP on tap for next week
- European stocks surge on LVMH
- Nasdaq 100 technical analysis shows some warnings signs for bulls
European equity markets rallied during the early EU session, which helped to lift futures for the S&P 500 and the Nasdaq 100 from their earlier lows. At the time of writing, US index futures pointed to a small rise at the open. But could investors apply the brakes on the rally that has propelled Wall Street stocks to record highs this week? Intel shares fell more than 10% in premarket trading following a gloomy forecast, putting pressure on other technology stocks. Investors were eagerly anticipating the release of the Fed’s favourite inflation measure later, ahead of next week’s FOMC policy decision and US non-farm payrolls report.
European markets extend rally
European stocks surged higher, buoyed by a series of earnings that surpassed expectations and the anticipation of a decline in euro-area interest rates. Shares in LVMH jumped by 10% due to a robust growth in fourth-quarter sales. Other luxury counterparts also rallied, supported by Barclays strategists upgrading their recommendation on the sector.
Core PCE inflation coming up
Investors will be closely monitoring the core PCE price index, the preferred inflation gauge of the Fed, set to be released later today, ahead of both the FOMC meeting and the nonfarm payrolls report in the week ahead. It is expected to ease to 3.0% on year-over-year basis, down from 3.2% previously.
The latest inflation data will come after a range of economic indicators presented conflicting signals about the world’s largest economy. While Q4 GDP exceeded expectations at +3.3% on an annualized basis, compared to the anticipated 2.0% and the previous quarter's 4.9%, the GDP deflator of +1.5% q/q fell short of the projected +2.3%, indicating declining price pressures. Additionally, an unexpected increase of 25,000 in jobless claims raised concerns.
The stronger GDP data followed a series of better-than-expected figures, including the Composite PMI for manufacturing and services reaching its highest level since June. Recent releases such as retail sales and the UoM's consumer confidence survey in the US have also surpassed expectations.
Nasdaq 100 analysis: Key risks facing stocks
However, while there are valid reasons for investor optimism, the question arises as to whether this optimism may be excessive given the current economic uncertainties. Can investors truly justify purchasing equities at these levels amidst a backdrop of uncertainty on a macro scale?
The rally has been supported by mostly strong earnings and investor conviction that major central banks like the Fed and ECB are gearing up to cut interest rates. China's measures to support its struggling equity markets further contributed to bolstering investor confidence this week.
However, expectations regarding early rate cuts have been pushed back by hawkish central bank speeches and data, while on a micro level, Intel’s bleak forecast, and Tesla’s underwhelming earnings have overshadowed the positive vibes we got from the likes of Netflix and IBM. Another concern is the lack of participation from non-tech stocks, with some investors suggesting that the optimism around A.I. could be a sign of irrational exuberance, particularly as many companies have yet to effectively monetize generative AI.
Additionally, the escalating shipping costs due to the Red Sea situation are expected to push up input costs, potentially leading to a new round of inflation and therefore further delays in interest rate cuts. Will the Fed highlight this risk at its policy decision next week?

Nasdaq 100 technical analysis
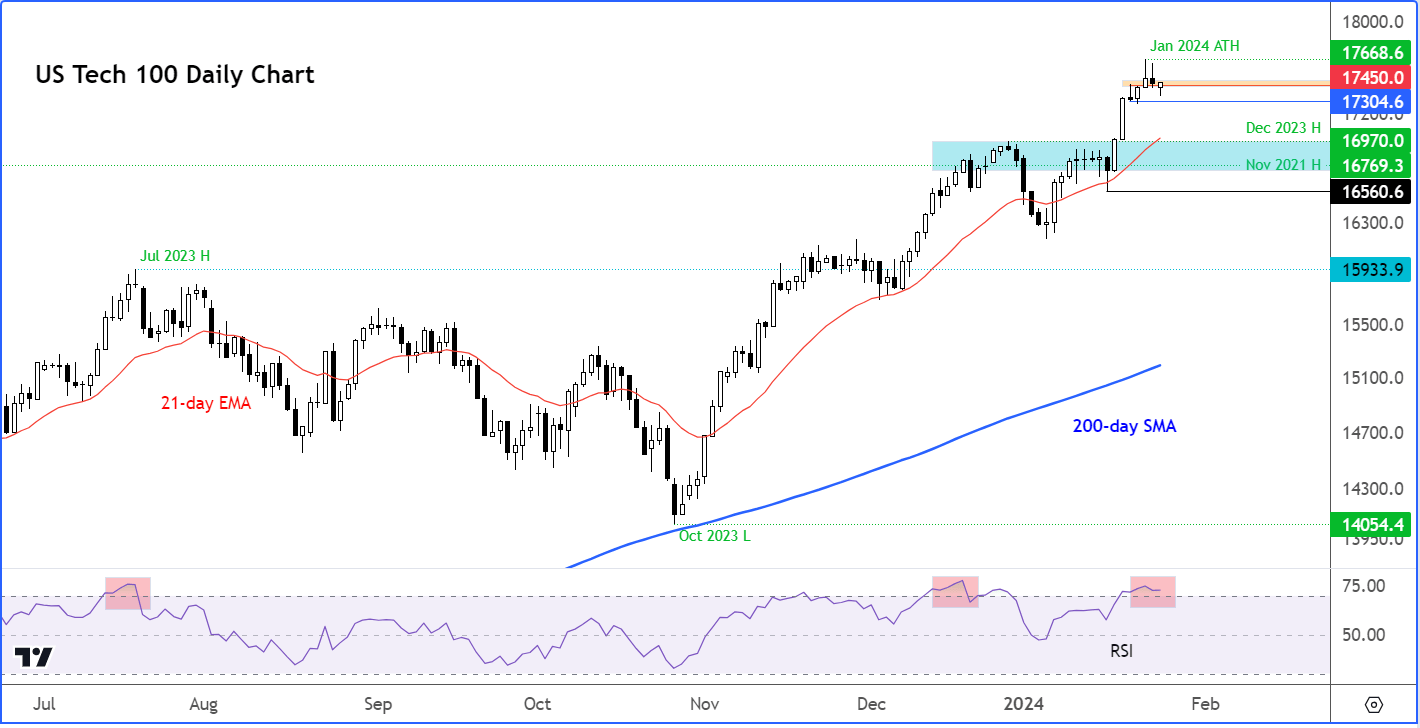
Source: TradingView.com
The Nasdaq has given us a couple of warning signals in the last few days to suggest the dazzling rally may be pausing for a breather, and that at least a small retracement could be on the cards. For one thing, the Nasdaq has reached technically overbought levels as indicated on the sub chart by Relative Strength Index (RSI) moving into ‘overbought’ threshold of above 70. For another, the index has formed a couple of inverted hammer candles to suggest the bullish momentum has faded, in part because of profit-taking.
So far however, there are no concrete reasons for the bears to show up meaningfully, as the index is only a spitting distance from reaching another record high, after repeatedly rising to unchartered territories in the past several days.
Speaking of record highs, the last major one was made at the end of last year at 16970. This level is now the most important support should we get a decent pullback from these elevated levels. The next level below that is the high from November 2021, at 16770. So, anywhere in between these two levels (i.e., in the 16770-16970 range) is where I would expect the dip-buyers to step in on a potential retracement.
A pullback, if seen, will not necessarily be a bad thing, as it will allow ‘overbought’ conditions to be worked off and give a chance for would-be buyers to step in at slightly lower levels. Short-term resistance is now seen starting from around 17450/55 area, which corresponds with the high from Monday and low from Thursday.
But if the potential retracement turns into something more than just that, and we see a break down in the market structure of higher highs and higher lows, then only at that point will the bears start to take note. Specifically, the level to watch for a shift in the trend is around 16560, corresponding to the low from the previous week. We are some distance away from it, but if concerns about over-stretched valuations rise, then investors may start selling, getting us to that level in no time.
For now, however, the trend is bullish and the strategy that has evidently been working for traders have been dip-buying rather than rip-selling.
-- Written by Fawad Razaqzada, Market Analyst
Follow Fawad on Twitter @Trader_F_R
How to trade with City Index
You can trade with City Index by following these four easy steps:
-
Open an account, or log in if you’re already a customer
• Open an account in the UK
• Open an account in Australia
• Open an account in Singapore
- Search for the company you want to trade in our award-winning platform
- Choose your position and size, and your stop and limit levels
- Place the trade
Latest market news
Yesterday 01:32 PM
Yesterday 09:35 AM
Yesterday 07:23 AM
Yesterday 04:48 AM
Yesterday 12:17 AM
July 25, 2024 10:39 PM
Latest Stocks articles

July 18, 2024 11:35 AM

June 13, 2024 02:00 PM

June 6, 2024 02:00 PM
June 2, 2024 08:00 AM