

Nasdaq 100 Takeaways
- US Q2 earnings season has been mixed, with many companies beating earnings estimates but top-line revenues only expected to rise 0.6% y/y.
- Weakness in highly weighted stocks like Apple and Tesla have been weighing on the Nasdaq 100 in particular.
- All eyes are on the 15,250 level in NDX this week, with a break below that area potentially opening the door for a deeper retracement.
Nasdaq 100 Fundamental Analysis
And just like that, earnings season was (mostly) behind us.
As of this weekend, fully 84% of the companies in the broad S&P 500 had reported their earnings results for Q2, and 79% of those companies have beat analysts’ earnings expectations, above the longer-term average of ~75%. Despite these ostensibly solid figures, major indices are trading roughly flat since earnings season kicked off in earnest in mid-July.
One potential culprit is slower-than-expected sales: “Only” 65% of the S&P 500 companies that have reported Q2 results have beat analyst earnings estimates, and the earnings mavens at FactSet estimate that the year-over-year growth rate for revenues will be a paltry 0.6% this quarter, the slowest since the depths of the COVID shutdowns.
Another reason that indices are struggling for traction this earnings season relates to concentration at the top. Traders are punishing a couple of the most highly-weighted “Big Tech” behemoths like Apple (AAPL) and Tesla (TSLA), which is dragging down concentrated market cap weighted indices like the S&P 500 and, especially, the Nasdaq 100.
Nasdaq 100 Technical Analysis – NDX Daily Chart
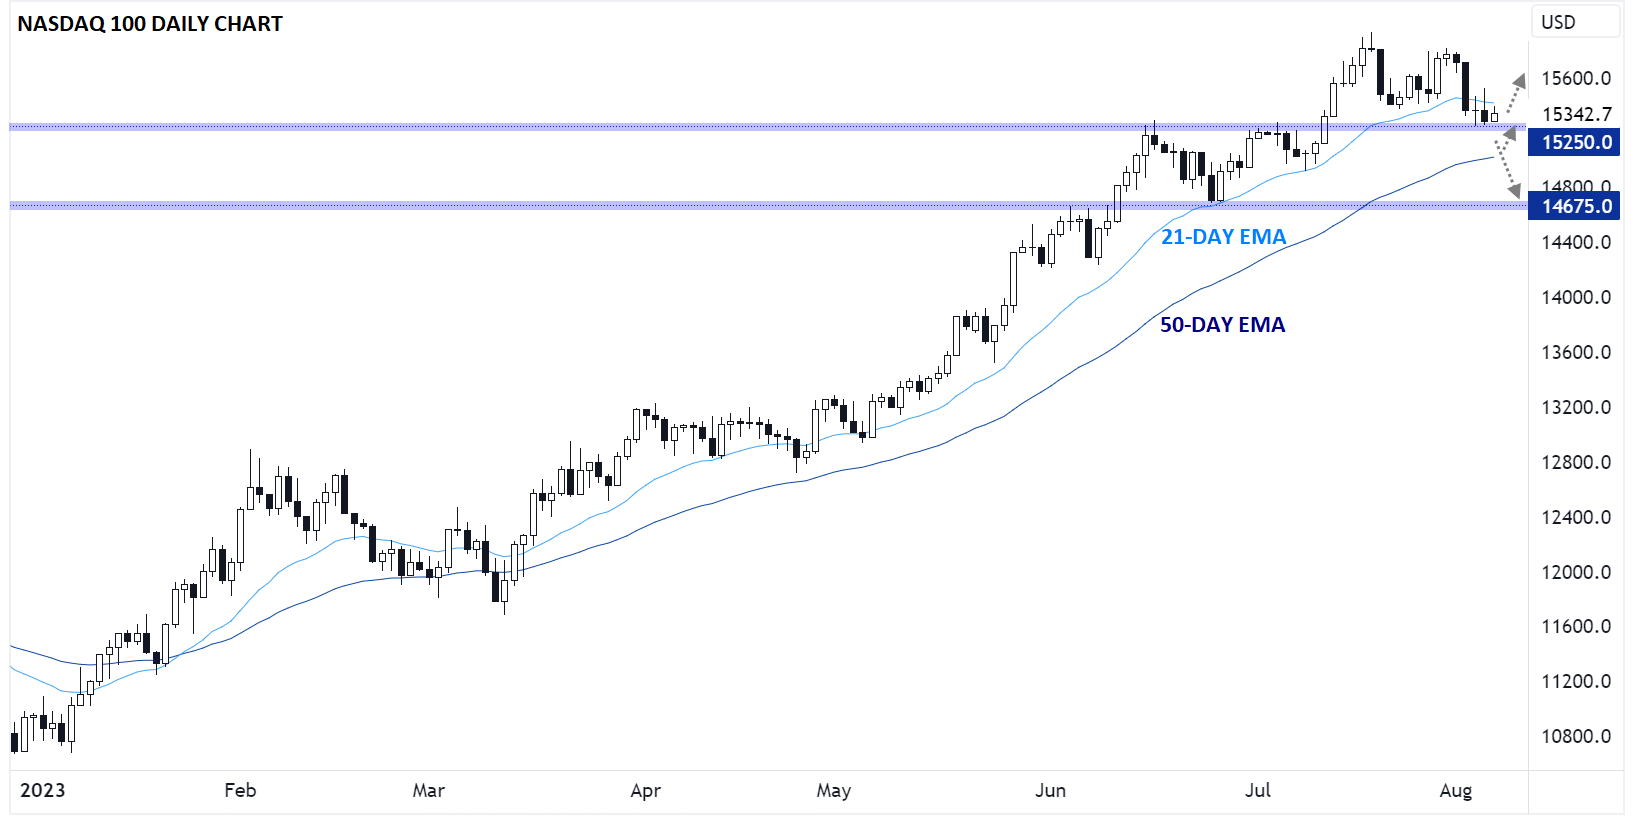
Source: TradingView, StoneX
Speaking of the tech-focused index, the Nasdaq 100 (NDX) is at a particularly interesting spot from a technical perspective heading into this week. As the chart above shows, the index has now put in a short-term “lower high” and “lower low,” suggesting that the year-to-date uptrend may be vulnerable to a deeper pull back in the coming weeks.
For now though, the key level to watch will be 15,250. That level marked the peak in mid-June and now that it’s been broken, it could provide support to keep the longer-term uptrend chugging along. If it holds through the early part of this week, bulls may shrug off the mixed earnings results we’ve seen thus far and push the index back toward the July highs in the upper-15,000s. On the other hand, a confirmed break below the 15,250 zone would open the door for a continuation down toward the 50-day EMA near 15,000 or potentially the next level of previous-resistance-turned-support at 14,675.
-- Written by Matt Weller, Global Head of Research
Follow Matt on Twitter: @MWellerFX
Latest market news
Yesterday 01:32 PM
Yesterday 09:35 AM
Yesterday 07:23 AM
Yesterday 04:48 AM
Yesterday 12:17 AM
July 25, 2024 10:39 PM
Latest Nasdaq articles

Yesterday 01:32 PM

July 25, 2024 01:17 PM

July 25, 2024 01:01 AM

July 23, 2024 01:38 PM