

Nasdaq 100 takeaways
- The Nasdaq 100 has now surged by more than 5% in less than two days after Nvidia’s stellar earnings in another sign of a potential AI bubble in the making.
- Positive signs around a potential debt ceiling deal and resilience in the US economy are also supporting the index.
- The next resistance level to watch is 14,355, the 61.8% Fibonacci retracement of the bear market
Nasdaq 100 fundamental analysis
Wednesday’s earnings from chipmaking giant Nvidia have provided a shot of adrenaline for risk appetite, and the Nasdaq 100 has been by far the biggest beneficiary.
At this point, it feels inevitable that “The Great AI Boom of 2023” will become “The Great AI Bubble of 2023,” if it hasn’t already, but that doesn’t mean that enthusiasm (and prices) can’t go much higher in the interim. As billionaire investor George Soros famously quipped, “When I see a bubble forming, I rush in to buy, adding fuel to the fire.”
It’s clear from this quarter’s earnings conference calls that many companies have the same idea:
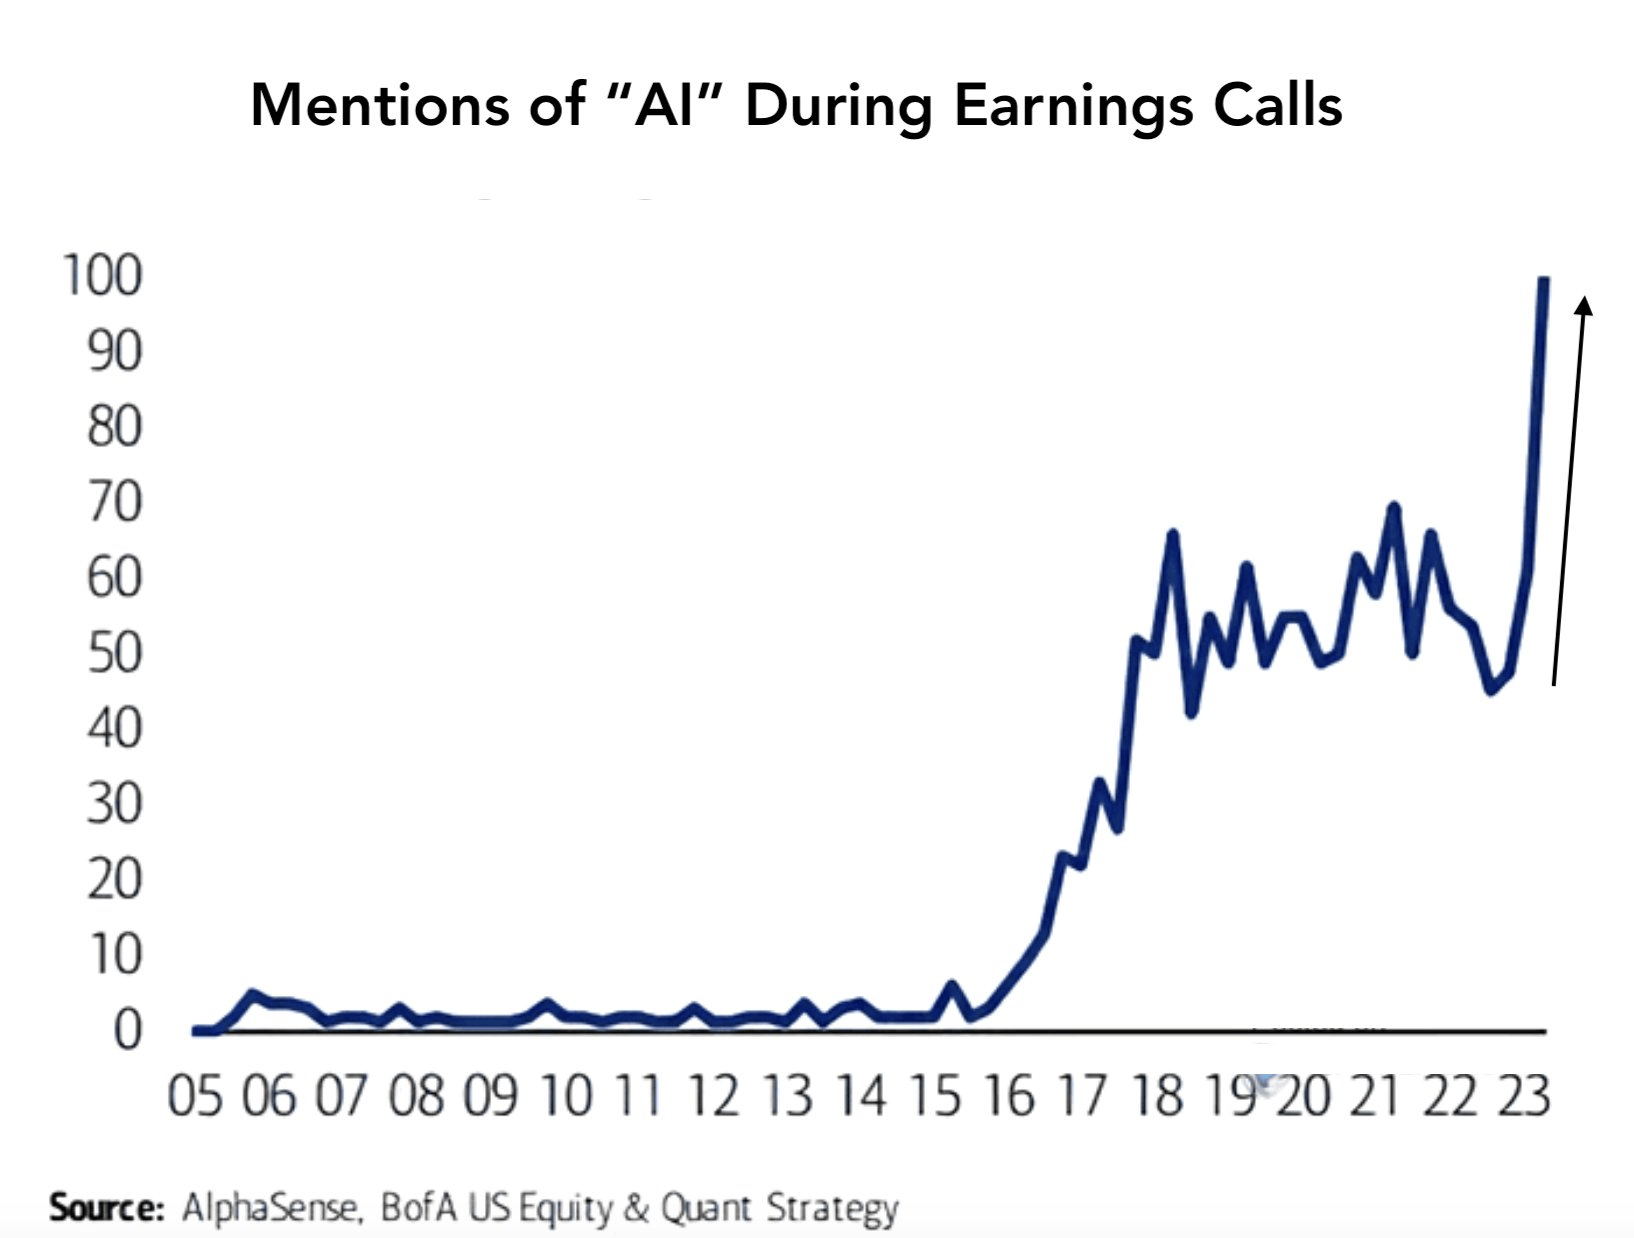
Source: Bank of America
Of course, the risk with hopping on such an obvious trend is being the “greatest fool,” or the last one to buy right at the top, but with continued positivity around a potential debt ceiling deal and this morning’s Core PCE report showing a more resilient US economy than expected, there are other fundamental storylines supporting today’s rally in the Nasdaq 100.
Nasdaq 100 technical analysis – NDX daily chart
Since Nvidia’s earnings after the bell on Wednesday, the Nasdaq 100 has rallied by more than 5% in less than two days, bringing the year-to-date return for the tech-heavy index to more than 30%.
Looking at the chart, the situation is relatively clear: The Nasdaq 100 remains in a strong uptrend, though prices are undoubtedly overbought in the short term, raising the risk of a pullback next week. If the short-term rally continues, the next notable resistance level to watch is the 61.8% Fibonacci retracement of the recent bear market near 14,355, with room up to the Q1 2022 highs above 15,000 if bulls can clear that hurdle.
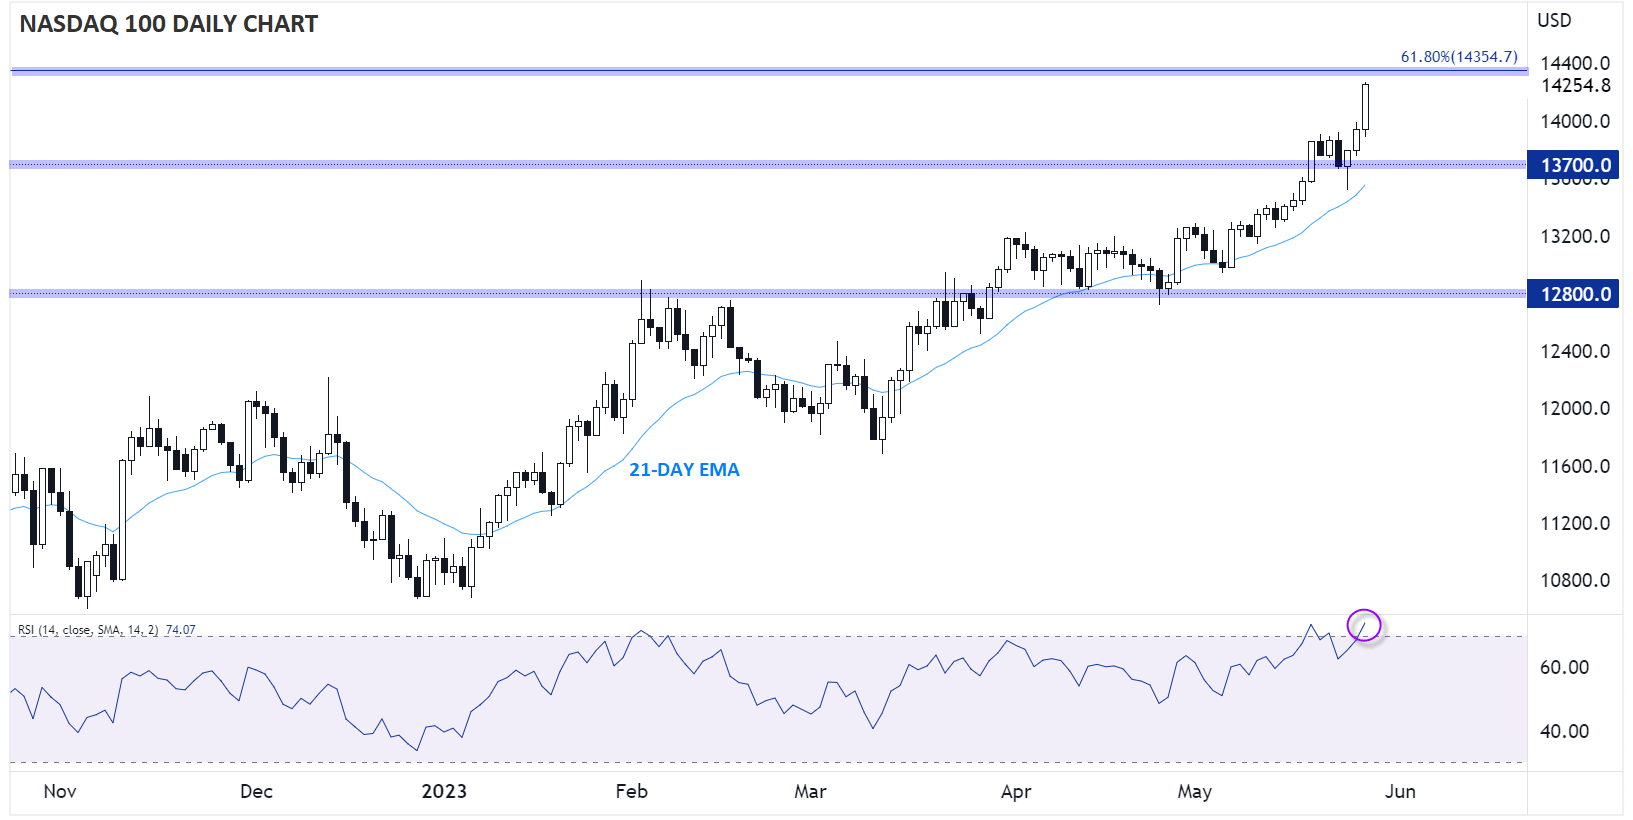
Source: Tradingview, StoneX
Meanwhile, more conservative traders may prefer to wait for a pullback toward 14,000 next week to join the uptrend at a potentially more favorable price. Only a confirmed close back below previous-resistance-turned-support at 13,700 would erase the near-term bullish bias.
-- Written by Matt Weller, Global Head of Research
Follow Matt on Twitter: @MWellerFX
Latest market news
Yesterday 01:32 PM
Yesterday 09:35 AM
Yesterday 07:23 AM
Yesterday 04:48 AM
Yesterday 12:17 AM
July 25, 2024 10:39 PM
Latest Nasdaq articles

Yesterday 01:32 PM

July 25, 2024 01:17 PM

July 25, 2024 01:01 AM
July 23, 2024 01:38 PM