
Nasdaq 100 takeaways
- A stronger-than-expected earnings season is supporting the risk-sensitive growth stocks that make up the Nasdaq 100.
- The index remains in a well-defined uptrend, with room for a continuation toward the 1-year highs near 13,700 in the coming days.
- At this point, only a reversal back below the 50-day EMA and previous-resistance-turned-support around 12,800 would erase the current bullish bias.
Nasdaq 100 fundamental analysis
As we enter arguably the last major week of earnings season, there’s no denying it: US corporations have, by and large, performed better than most analysts were expecting.
According to the earnings mavens at FactSet, with 92% of S&P 500 companies’ results in the books, 78% have beaten earnings estimates, above the 10-year average of 73%, and 75% of S&P 500 companies have beaten analysts’ revenue estimates (vs. the 10-year average of 63%). These numbers are even more pronounced outside of the financial sector, which has been hit by tightening lending standards and a rising cost of capital amidst on the ongoing “bank walk.”
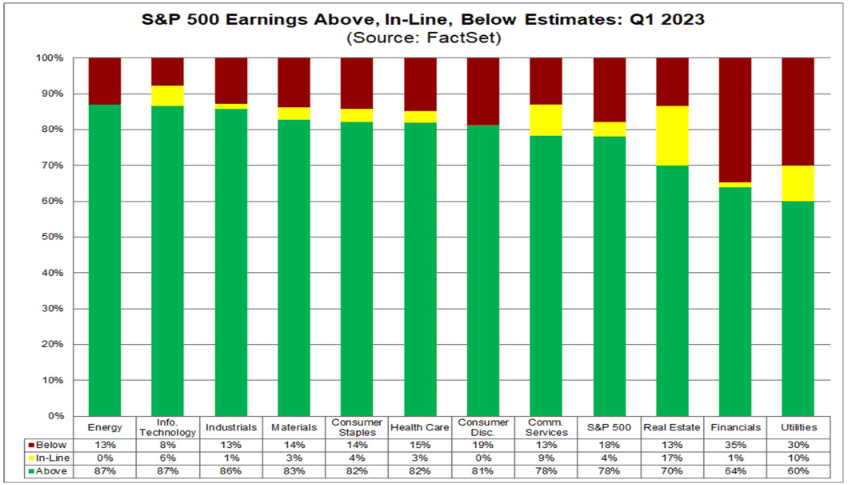
Source: FactSet
Put simply: Despite some signs of slowing macroeconomic growth, US corporations continue to outperform expectations, and that’s disproportionally supporting risk-sensitive growth stocks, like those that make up the Nasdaq 100 index.
Nasdaq 100 technical analysis – NDX Daily Chart
Against that fundamental backdrop, it’s not surprising that the Nasdaq 100 just saw its highest weekly close since last summer. As the chart below shows, the index is in a well-defined uptrend, with any short-term dips consistently finding support between the rising 21-day and 50-day EMAs since the start of last year.
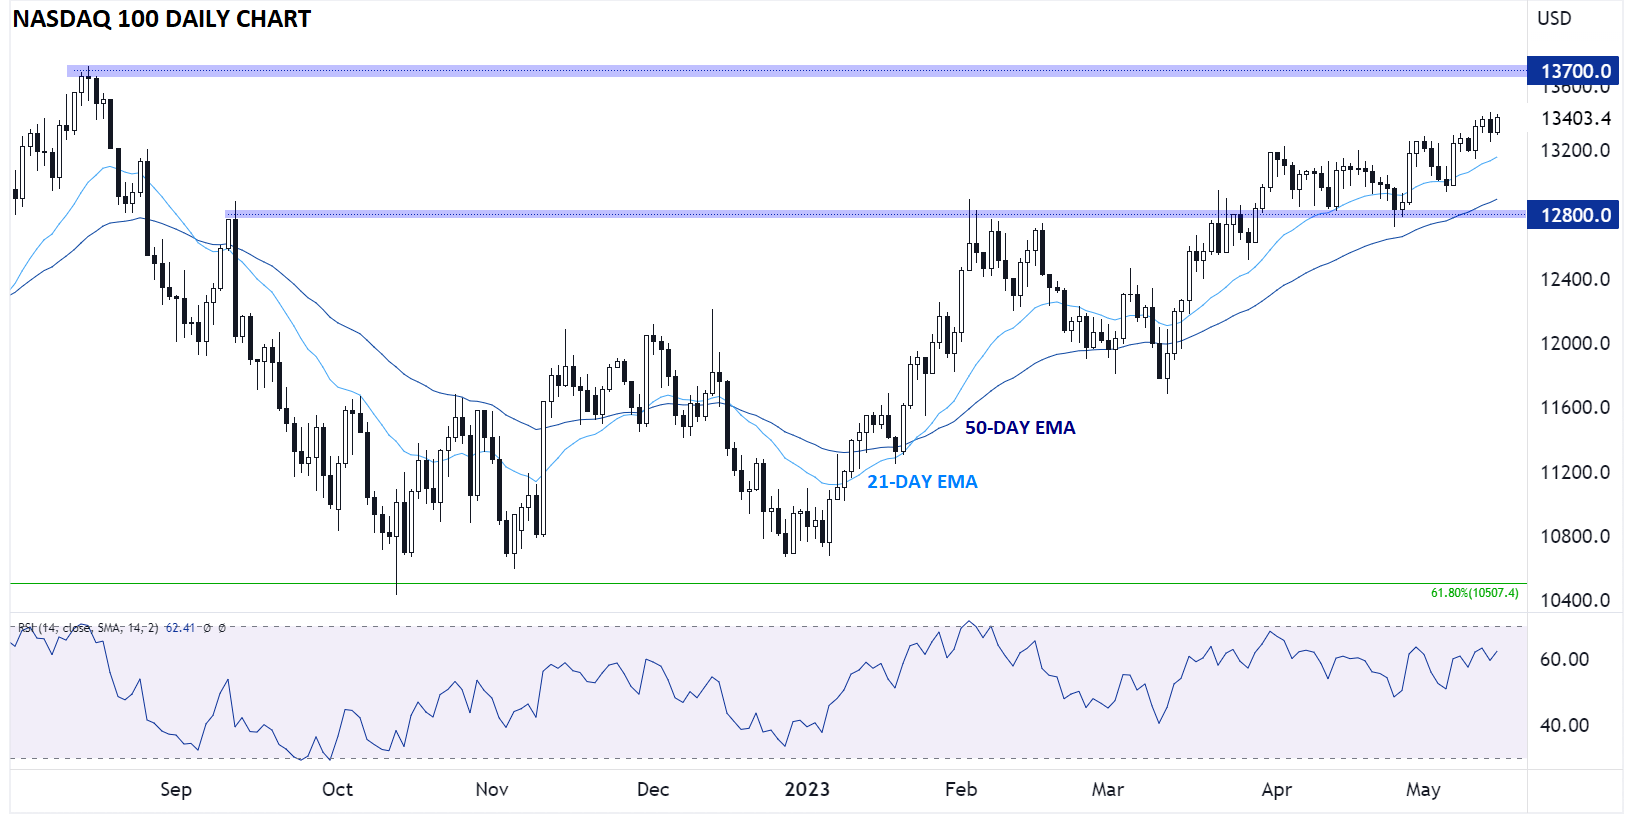
Source: Tradingview, StoneX
Between ongoing debt ceiling negotiations, Fedspeak, retail sales, and retailer earnings, there are still plenty of fundamental events to watch this week, but from a purely technical perspective, the path of least resistance for the Nasdaq 100 remains to the topside, with little in the way of major resistance until the 1-year high near 13,700. At this point, only a reversal back below the 50-day EMA and previous-resistance-turned-support around 12,800 would erase the current bullish bias.
-- Written by Matt Weller, Global Head of Research
Follow Matt on Twitter: @MWellerFX
How to trade with City Index
You can trade with City Index by following these four easy steps:
-
Open an account, or log in if you’re already a customer
• Open an account in the UK
• Open an account in Australia
• Open an account in Singapore
- Search for the market you want to trade in our award-winning platform
- Choose your position and size, and your stop and limit levels
- Place the trade
Latest market news
Yesterday 01:32 PM
Yesterday 09:35 AM
Yesterday 07:23 AM
Yesterday 04:48 AM
Yesterday 12:17 AM
July 25, 2024 10:39 PM
Latest Nasdaq articles

Yesterday 01:32 PM

July 25, 2024 01:17 PM

July 25, 2024 01:01 AM

July 23, 2024 01:38 PM