January 26, 2022 2:20 PM

SPX 500
- Resistance:
- 4443/4450: 200-Day Moving Average and 38.2% Fibonacci retracement of the January 4th high to the January 24th low
- 4492: Horizontal Resistance
- 4521: 50% retracement from the high of January 4th to the low of January 24th
- Support:
- 4285: January 25th low
- 4222/4214: January 24th low and 38.2% Fibonacci retracement from the November 2nd, 2020 low to the January 4th high
- 4138: Horizontal support
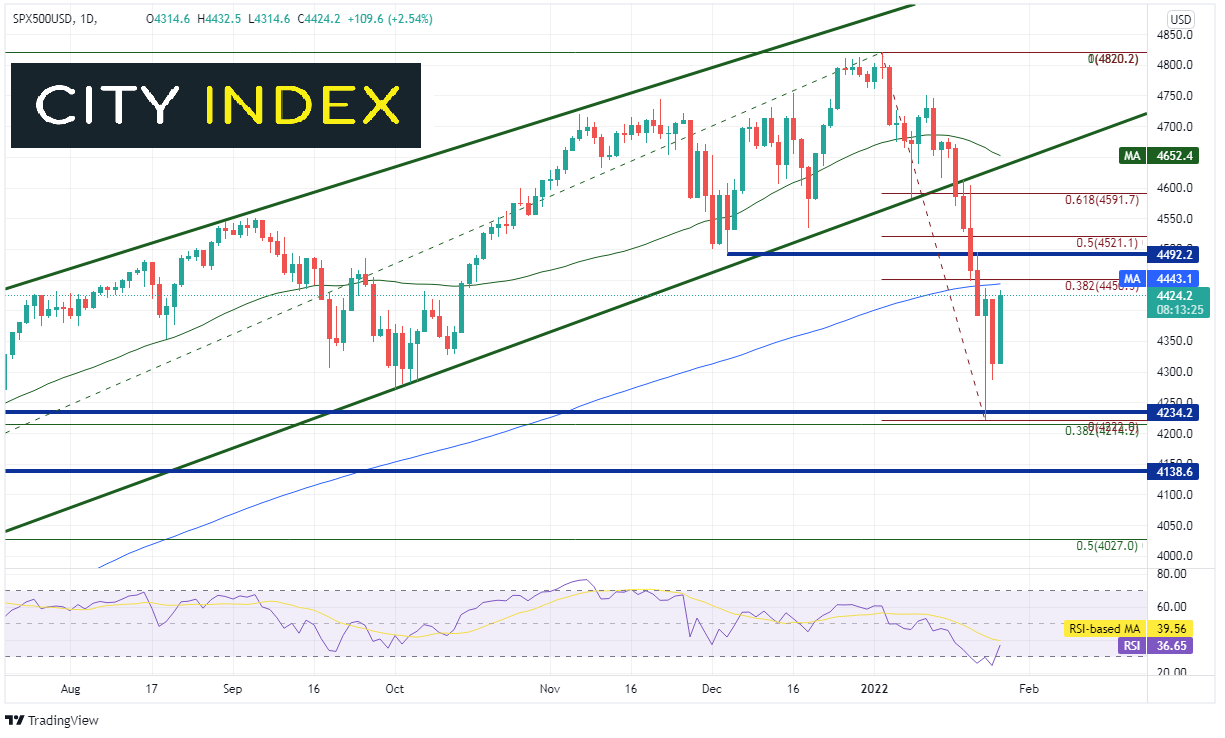
Source: Tradingview, Stone X
Trade SPX 500 now: Login or Open a new account!
• Open an account in the UK
• Open an account in Australia
• Open an account in Singapore
NDQ 100
- Resistance:
- 14886/15508: 38.2% Fibonacci retracement from the high of November 22nd, 2021 to the low of January 24th and 200 Day Moving Average
- 15165: Horizontal Resistance
- 15245: 50% Fibonacci retracement from the high of November 22nd, 2021 to the low of January 24th
- Support:
- 14033: January 25th low
- 13725: January 24th low at the 50% retracement from the low of September 21st, 2020 to the high of November 22nd, 2021
- 13960/12968: 61.8% Fibonacci retracement from the low of September 21st, 2020 to the high of November 22nd, 2021 and horizontal support
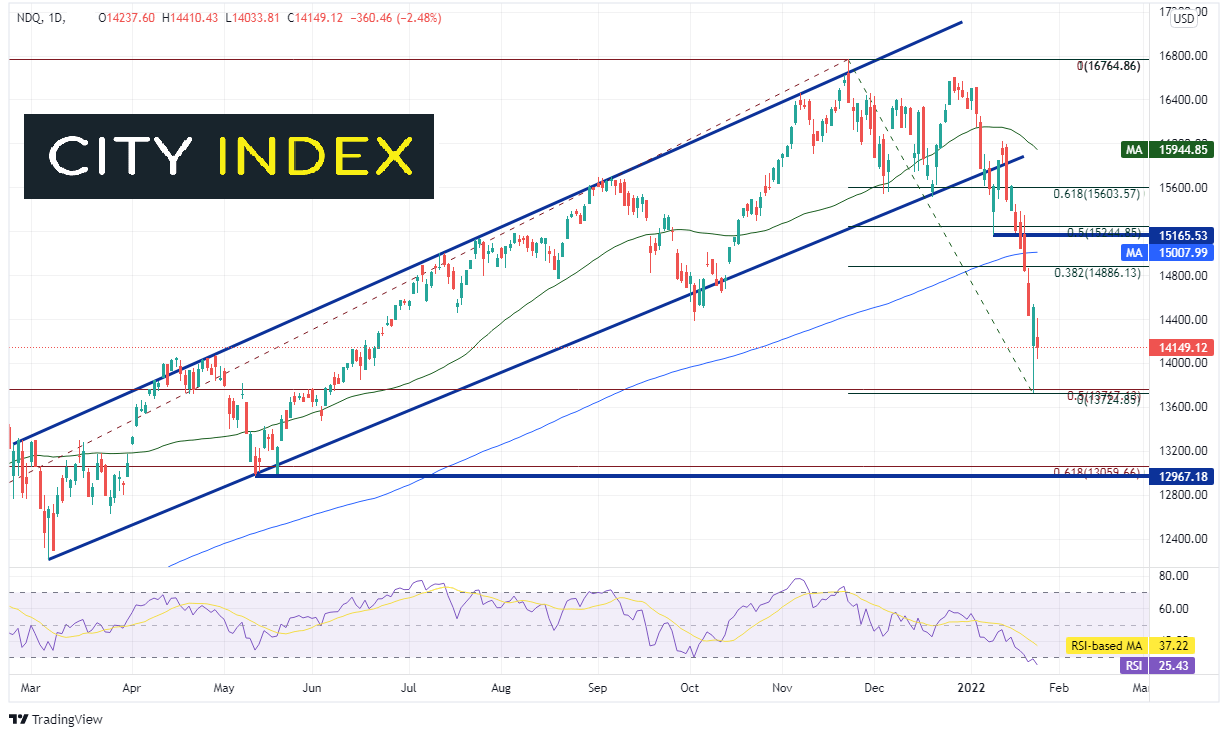
Source: Tradingview, Stone X
Trade NDQ 100 now: Login or Open a new account!
• Open an account in the UK
• Open an account in Australia
• Open an account in Singapore
Latest market news
Yesterday 01:32 PM
Yesterday 09:35 AM
Yesterday 07:23 AM
Yesterday 04:48 AM
Yesterday 12:17 AM
July 25, 2024 10:39 PM
Latest SPX 500 articles

July 25, 2024 01:30 PM

July 23, 2024 11:45 AM

July 22, 2024 02:12 PM

July 18, 2024 11:35 AM