

Japanese Yen Takeaways
- The yen has rallied across the board over the last week+, but traders may now look to take profits ahead of the weekend.
- USD/JPY is testing key previous-resistance-turned-support at 138.00 after breaking its multi-month uptrend.
- EUR/JPY and GBP/JPY remain in healthy uptrends and show signs of reversing their recent losses.
Japanese Yen Fundamental Analysis
The big news in the FX market this week remains the ongoing selloff in the US dollar, a move driven by falling expectations of interest rate increases from the Federal Reserve beyond this month, but expectations for another central bank’s path are also driving big market moves.
Traders are increasingly convinced that the Bank of Japan will take its first steps toward tightening monetary policy at the end of this month, potentially by relaxing its yield curve control (YCC) program. The yen has accordingly rallied sharply, against the US dollar in particular, dashing the prospects of imminent intervention in the market by the BOJ. Below, I break down the technical outlook and key levels to watch on the most-traded yen crosses, USD/JPY, EUR/JPY, and GBP/JPY.
Japanese Yen Technical Analysis – USD/JPY Daily Chart
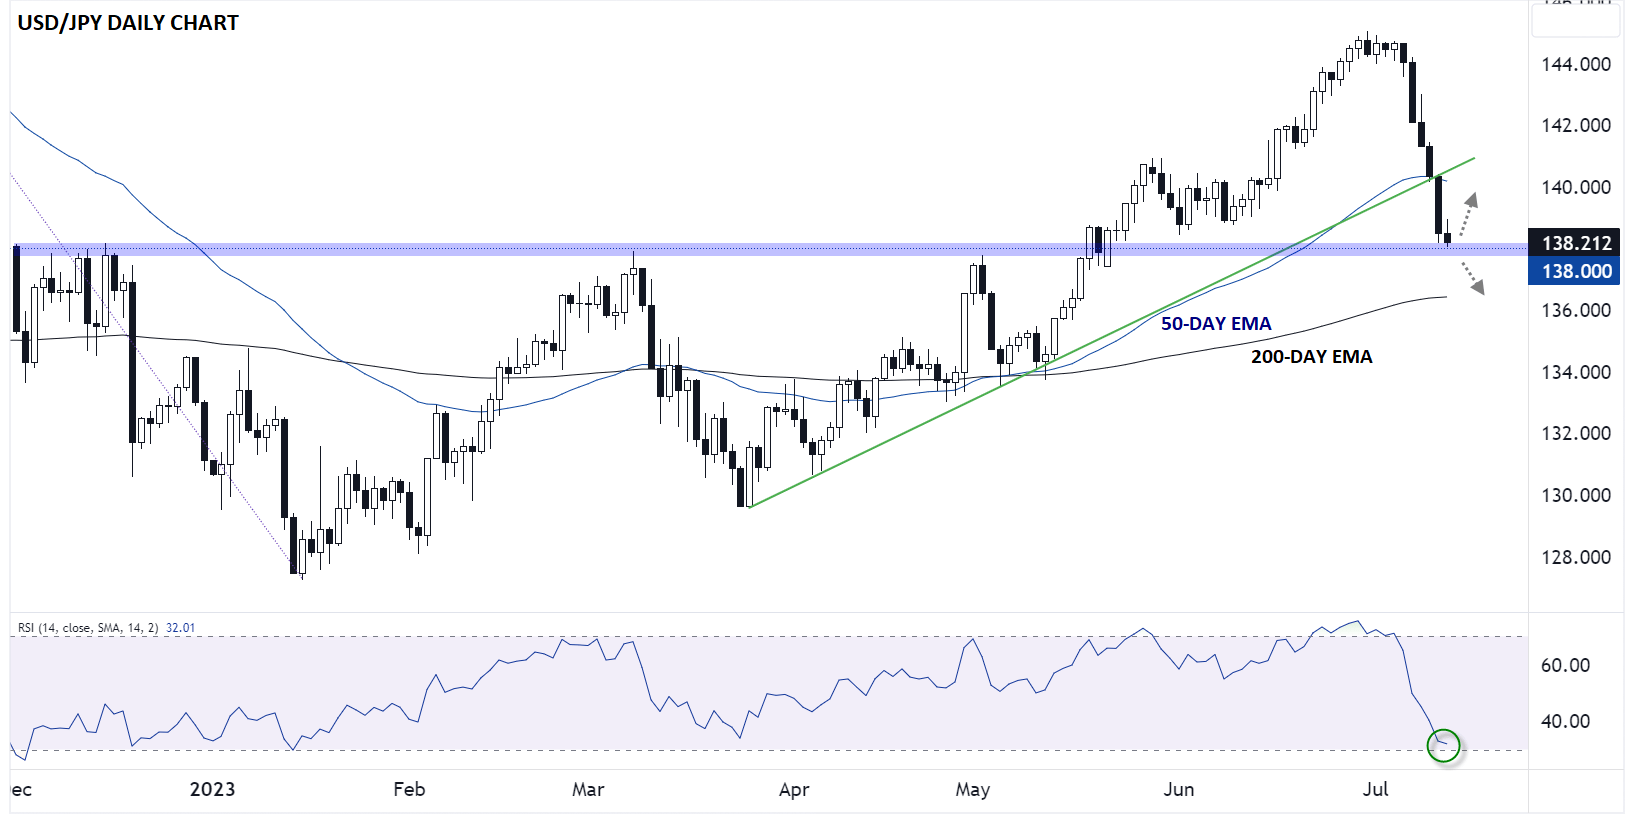
Source: TradingView, StoneX
As noted above, USD/JPY has seen a particularly steep decline over the last week+, though rates are now approaching their most oversold levels of the year. As the daily chart shows, USD/JPY sliced through its 50-day EMA and rising trend line support without so much as a momentary pause earlier this week, suggesting that a continuation down to previous-resistance-turned-support at 138.00 was likely.
As we go to press, USD/JPY is seeing its downside momentum stall so far today as it nears that support level, so a bounce back toward 139.00 or 140.00 heading into the weekend would not be surprising. That said, given this week’s big technical breakdown, the bullish medium-term technical bias of the past few months is unlikely to return unless/until the pair can definitively recapture the 140.00 handle.
While not the most likely scenario, a bearish acceleration through 138.00 support would expose the 200-day EMA around 136.50 next.
Japanese Yen Technical Analysis – EUR/JPY Daily Chart
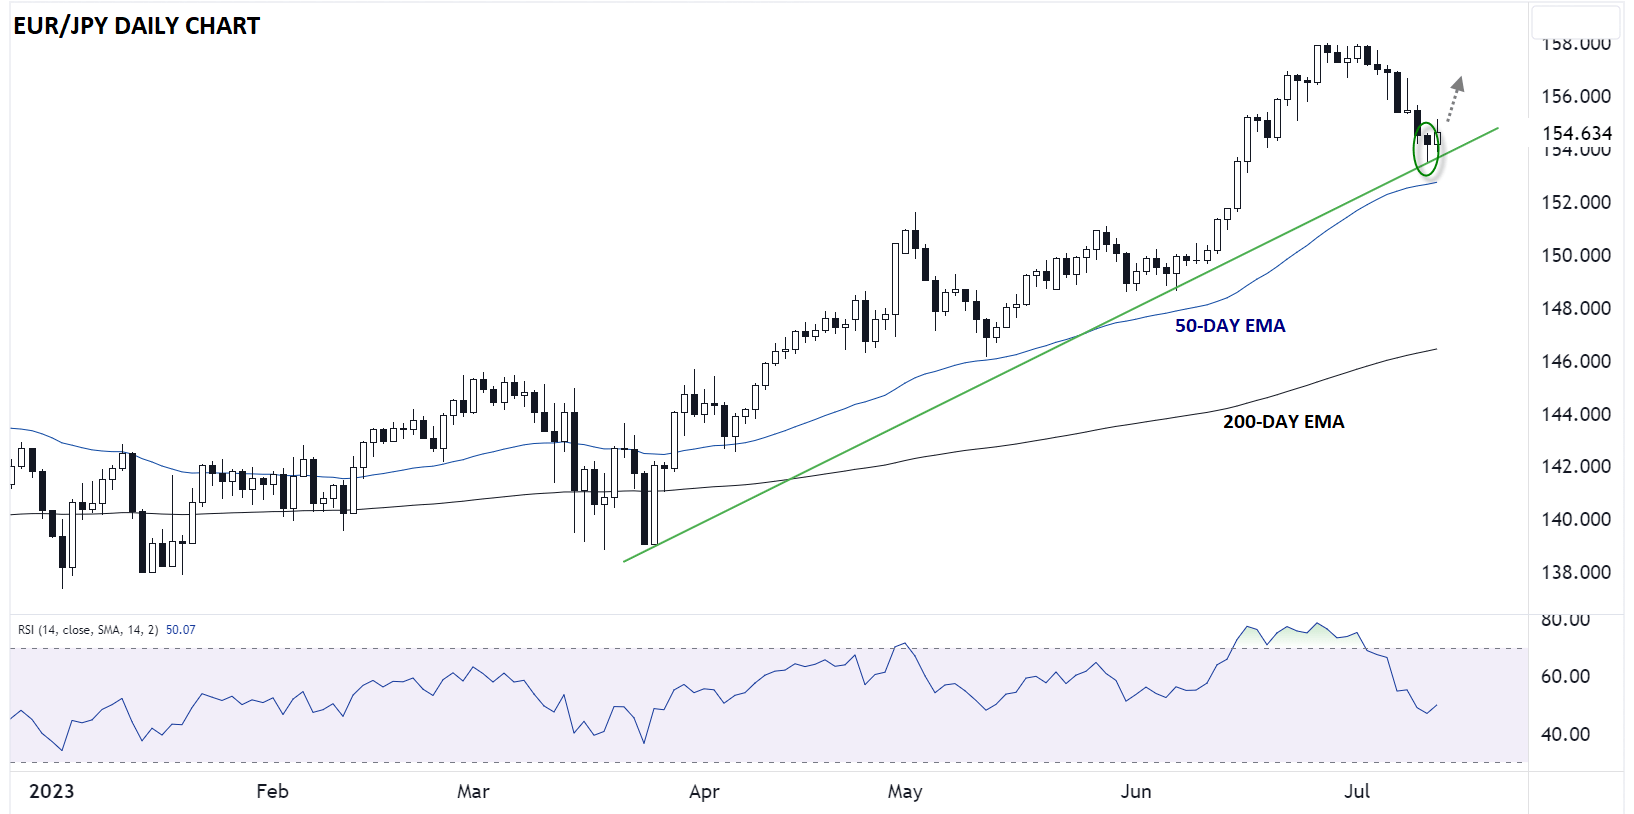
Source: TradingView, StoneX
EUR/JPY, by contrast, remains solidly within its well-defined uptrend, despite July’s pullback. Yesterday’s price action formed a “hammer” candlestick pattern, signaling an intraday shift from selling to buying pressure and marking a potential near-term bottom at trend line support. As long as yesterday’s low near 153.50 holds, the path of least resistance for EUR/JPY remains to the topside for a potential rally back toward 157.00+.
Japanese Yen Technical Analysis – GBP/JPY Daily Chart
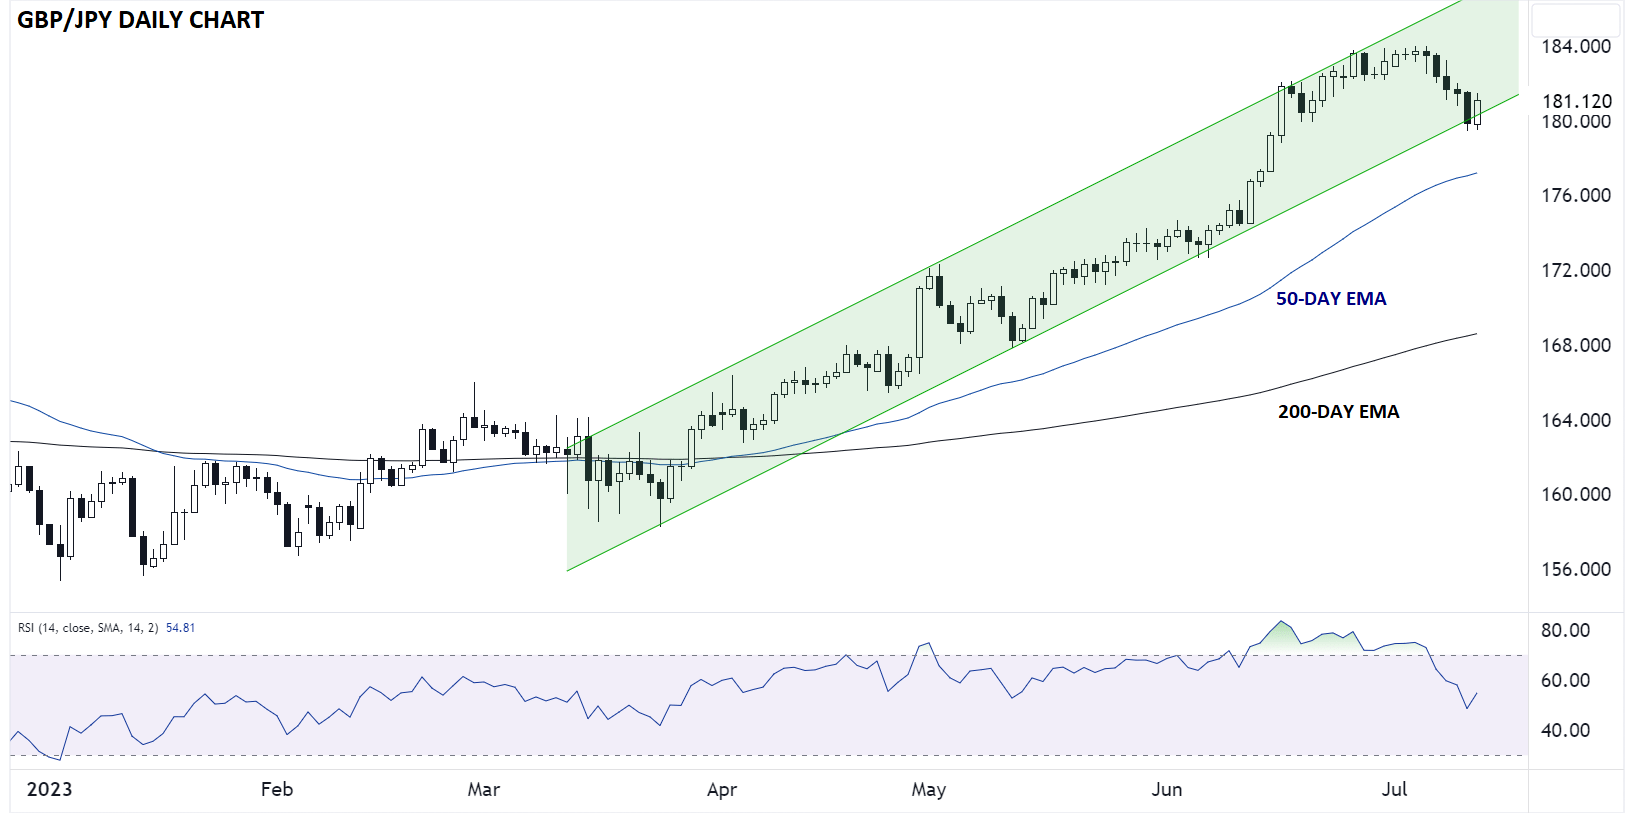
Source: TradingView, StoneX
Last but not least, GBP/JPY remains in a bullish technical structure of its own. The pair is bouncing today after testing the bottom of its rising channel off the March lows, suggesting that for now at least, bulls are eager to join the established uptrend at a discount. Assuming the pair remains above yesterday’s low around 179.50, a retest of last week’s 8-year highs around 184.00 looks more likely than not.
A break below this week’s low would hint at a continuation lower, with the 50-day EMA around 177.25 as the next logical support level.
-- Written by Matt Weller, Global Head of Research
Follow Matt on Twitter: @MWellerFX
Latest market news
Yesterday 01:32 PM
Yesterday 09:35 AM
Yesterday 07:23 AM
Yesterday 04:48 AM
Yesterday 12:17 AM
July 25, 2024 10:39 PM
Latest Yen articles

November 3, 2023 02:48 PM

September 14, 2023 03:28 PM

March 28, 2023 02:45 AM
January 27, 2023 12:37 AM