

- GBP/USD outlook: US dollar unlikely to turn sharply lower any time soon
- Pound unlikely to find help from UK data with economy on the brink
- GBP/USD could be heading below 1.20 or even 1.18
Heading into the final months of 2023, the GBP/USD was on a protracted downtrend. While we can’t rule out the possibility of an oversold bounce, we think that more losses are likely in Q4 with the cable likely to fall to 1.20 or lower. Forward-looking UK macro indicators paint a gloomy picture for the UK economy, while a hawkish Fed, rising risk aversion and rallying crude oil prices should all keep the dollar supported on the dips.
Why has GBP/USD declined so much?
The GBP/USD has fallen sharply ever since topping out in July. But it wasn’t just the cable that topped out in July. The likes of the EUR, CHF and JPY all peaked against USD in that month too, along with the major indices like the S&P, Nasdaq and DAX. Therefore, the bulk of GBP/USD’s weakness was due to the US dollar surging higher thanks to a hawkish Fed, as well as other external factors: namely, falling risk appetite and rising oil prices (both USD-positive).
But what about domestic factors? Judging by price action in other GBP crosses, the pound started to weaken more broadly from around the end of August, when we saw repeated weakness in UK data. This caused investors to scale back UK interest rate hike expectations – slowly at first, then more rapidly later. From pricing in three more 25 basis point rate hikes, all of a sudden it was just one more hike being priced in for the remainder of 2023 ahead of the Bank of England’s last meeting on September 21. But in that meeting, a split BoE voted to keep rates unchanged at 5.25% when a hike was expected. This further fuelled renewed expectations that UK interest rates have peaked. Consequently, we saw an accelerated move lower in the GBP/USD and other pound crosses.
UK economy on the brink
In the last two years, UK inflation and (consequently) interest rates have shot higher, more so than many other developed nations. Here, it is quite common for households to fix their mortgages for 2 or 5 years. As more and more mortgages came out of their fixed terms, households, who were already facing high energy bills and elevated prices for goods, had to fork out hundreds more to make up their monthly loan payments. This meant that non-essential spending had to be put on hold. This was evidenced in monthly GDP estimate for July, which revealed output fell 0.5% on the month.
The more forward-looking economic indicators such as the Purchasing Managers’ Indices (PMIs) have not only remained in the contraction territory (<50.0), but the pace of the weakness have been deteriorating. The manufacturing PMI has remained below 50.0 for 13 consecutive months, with the monthly prints missing the already-downbeat expectations for the past 6 months. The services PMI has only moved below 50.0 a couple of months ago, but it too has been missing expectations for the last 5 consecutive months.
The PMIs suggest the near-term UK outlook is gloomy. This argues against a speedy recovery in GBP/USD and other pound crosses. The only hope for GBP/USD bulls insofar as the short-term is concerned if US dollar were to top out.
GBP/USD outlook: US dollar unlikely to turn sharply lower any time soon
Heading to the start of Q4, the US dollar has enjoyed one of its longest winning streaks against nearly all major currencies. The dollar index closed higher for 11 consecutive weeks and looked to make that 12 at the time of writing in the first week of October.
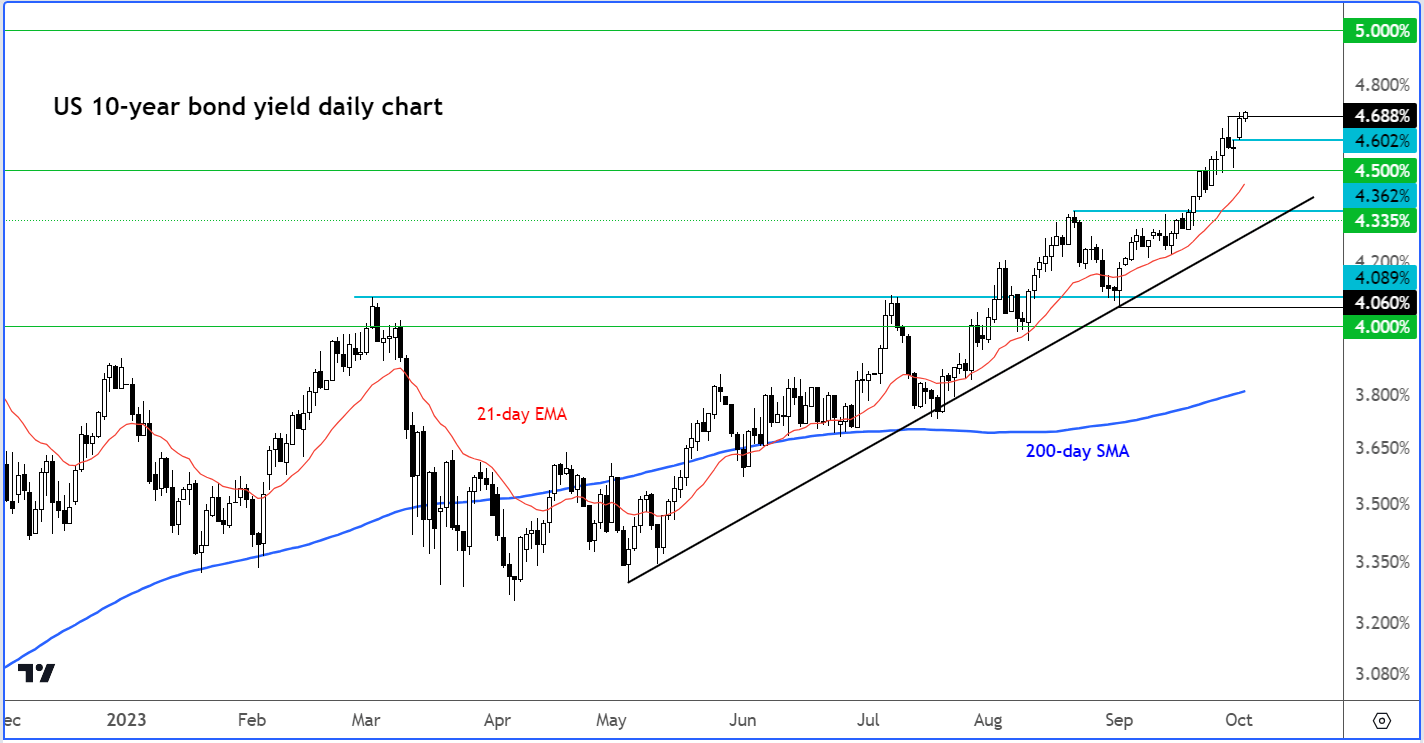
Stronger data and signs of inflation remaining stickier, plus the recent OPEC-inspired crude oil gains, have all helped to encourage policymakers at the Federal Reserve to maintain a hawkish outlook on interest rates. Expectations for the first interest rate cut have been pushed back well into the second half of 2024, with the FOMC projecting just two rate cuts instead of 4 it had previously projected for next year. Accordingly, the 10-year Treasury yield has risen above 4.50% for the first time since 2007, potentially paving the way for 5.0%.
A more hawkish central bank than elsewhere is precisely why US bond yields and the dollar have enjoyed such a strong rally. This strong bullish dollar trend argues against a quick GBP/USD recovery in Q4. After all, strong trends need to weaken first before they can reverse. For the tide to turn, time is needed. It could be weeks, if not months. Therefore, any short-term strength in the GBP/USD should not be mistaken for a trend reversal, if not backed by a trend of strong UK data (unlikely – see above) and/or a trend of weaker US data (more plausible).
The dollar bears need something to happen or change immediately. For example, another credit ratings downgrade amid the ballooning debt levels in the US and, more worrying, rising costs of servicing the debt. Another trigger behind a potential dollar sell-off could be a government shutdown, which has been averted for now with a stopgap spending bill until November 17th.
GBP/USD key levels to watch
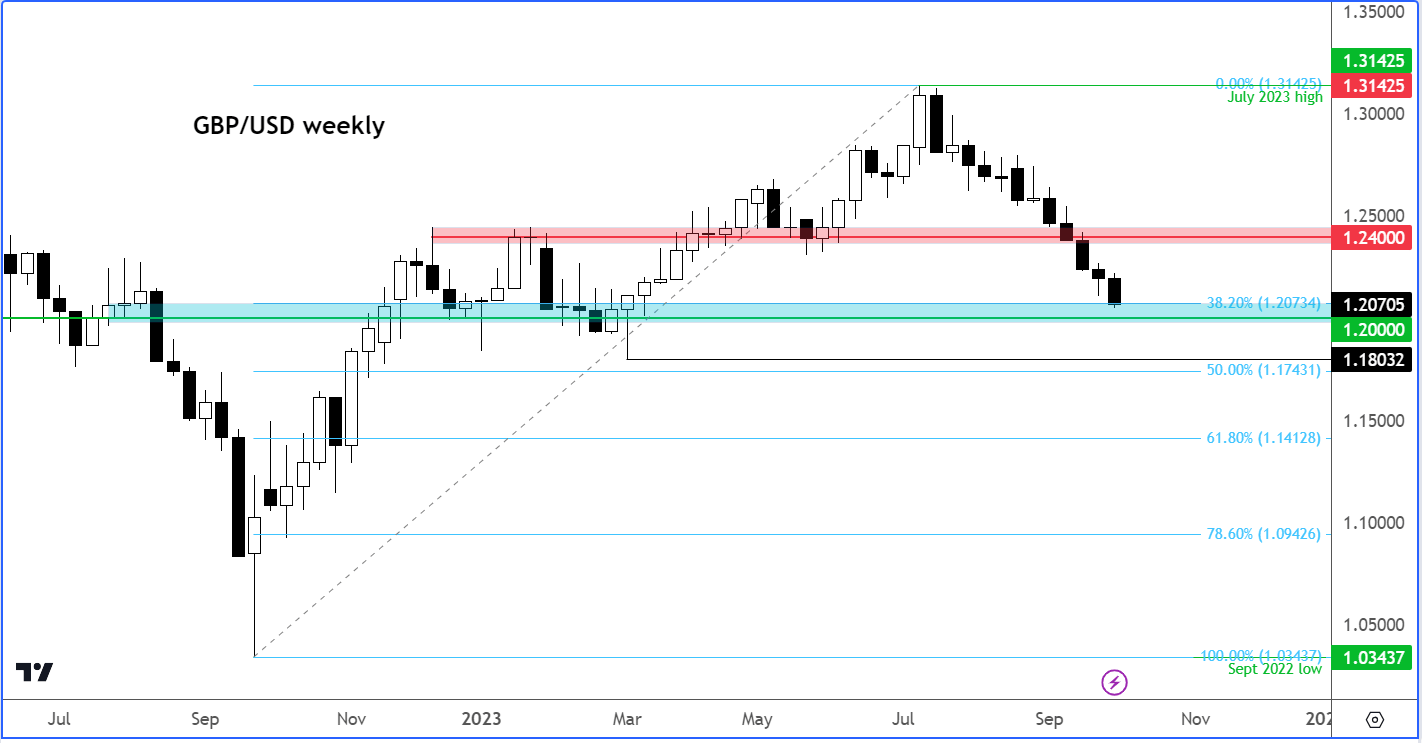
With key support around 1.2400 clearly broken down, and the GBP/USD moving and holding below it, this means the path of least resistance remains to the downside. The cable could be heading to 1.2000 next, where it had previously found support from. However, given the macro reasons mentioned, there is no reason why it can’t head further lower, even after a bounce, to a new low on the year below the March low of 1.1803.
In a nutshell
All told, we maintain a bearish view on the GBP/USD outlook even if the selling looks quite extended on all time frames. If there is a bounce to be seen, this is likely to be short-lived. We reckon the cable could be heading to 1.20 and possibly 1.18 in the weeks ahead.
-- Written by Fawad Razaqzada, Market Analyst
Follow Fawad on Twitter @Trader_F_R
Source for all charts used in this article: TradingView.com
How to trade with City Index
You can trade with City Index by following these four easy steps:
-
Open an account, or log in if you’re already a customer
• Open an account in the UK
• Open an account in Australia
• Open an account in Singapore
- Search for the company you want to trade in our award-winning platform
- Choose your position and size, and your stop and limit levels
- Place the trade
Latest market news
Yesterday 01:32 PM
Yesterday 11:30 AM
Yesterday 04:11 AM
May 9, 2024 10:15 PM
Latest GBP USD articles

Yesterday 11:30 AM

May 9, 2024 07:40 AM

May 9, 2024 04:43 AM
May 8, 2024 12:00 PM