

- FTSE analysis: Energy stocks find support on oil bounce
- European markets drop, led by Spain’s Ibex (-2%)
- FTSE technical analysis points to bullish breakout if Monday’s high is breached
Disappointing Eurozone data put some pressure on European indices on Thursday morning, following the sizeable rally in Europe and US the day before. This saw major European indices drop sharply this morning, led by a 2% fall in Spain’s Ibex. But the FTSE was holding its own relatively better, as rebounding crude oil helped to fuel a rally in energy stocks.
Video: FTSE, DAX, DXY, EUR/USD, AUD/USD, Gold and Silver analysis
Why have European markets fallen?
Chinese markets, which have decoupled from the rest of the world, continued to struggle overnight. We also saw industrial production in Germany fall for six straight months, dropping 0.7% month-over-month this time after falling 0.3% in October. This means that industrial production is now more than 9% below its pre-pandemic level. These factors kept growth-sensitive mining stocks under pressures. On top of this, industry data indicated that British retailers experienced lacklustre sales during the Christmas season, contributing to growing worries about a potential mild recession in the economy. Shares of retailers like JD Sports fell.
FTSE analysis: Energy stocks find support on oil bounce
Despite the weakness for the FTSE, there was positive news for energy stocks as crude oil prices staged a sharp 2% rally, following Monday’s slide driven by news Saudi Arabia had slashed its official selling price to Asian importers to a 27-month low. BP was up 1.4% by mid-morning London session, at the top of the FTSE’s leader board.
The FTSE’s downside was also limited due to a weaker pound, hurt by news of a softer like-for-like retail sales in December. The BRC Retail Sales Monitor eased to 1.9 y/y in December from 2.6% the month before, easily missing expectations for a print of 2.3%. The FTSE tends to rise when the pound falls, everything else being equal.
FTSE analysis: Technical levels to watch
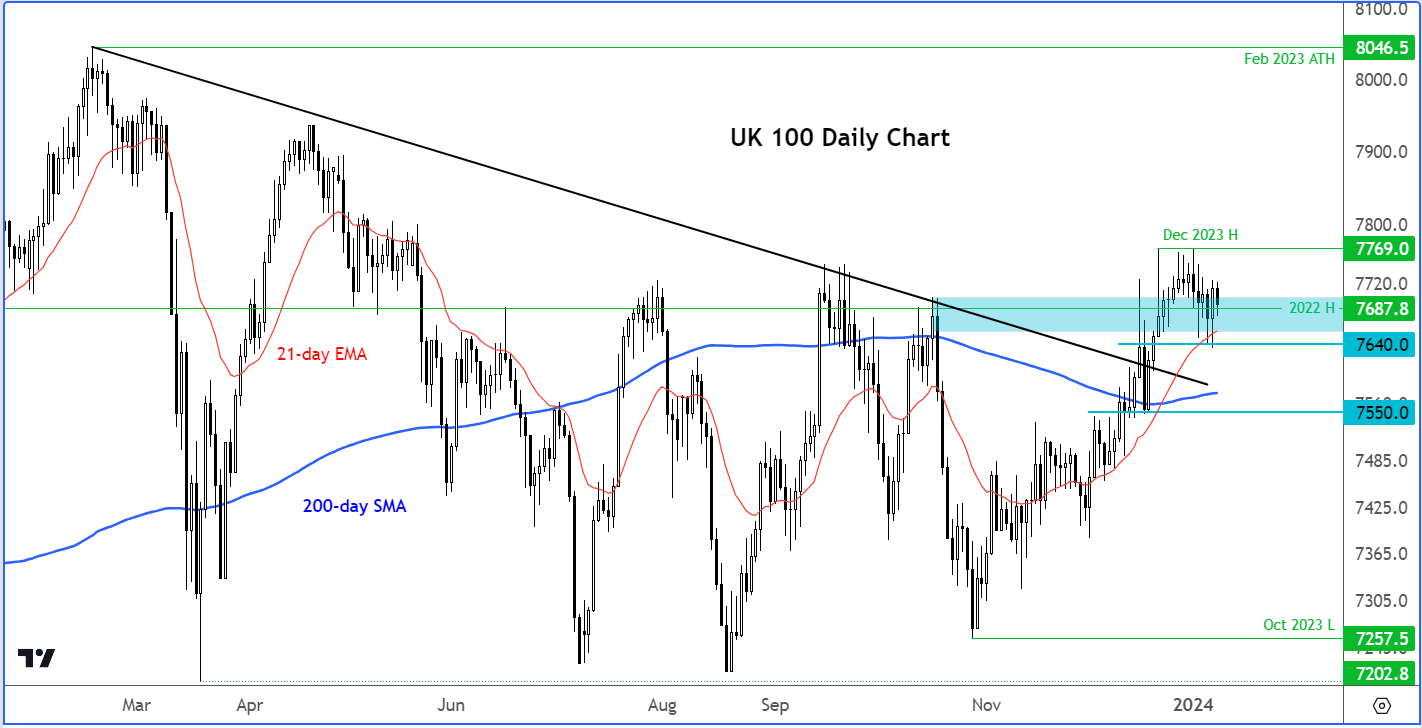
Source: TradingVIew.com
The FTSE's broken bearish trend line indicates an upward trajectory for the UK benchmark index, despite a slow start to the new year. Currently, the UK benchmark index is testing crucial support around 7680ish to 7700, an area that served as a formidable barrier throughout last year until it momentarily broken in December when the index hit its best level since May.
Monday’s hammer/engulfing candle that was formed around the 21-day exponential average suggests the bulls are still clinging on despite macro worries. But we will now need to see some upside follow-through and a break above Monday’s range at 7726 to trigger technical buying above that level.
In the event of a bullish breakout, the next targets on the upside include the December 2023 high just below 7770, followed by the February 2023 high of 8046. Conversely, a decisive drop below 7640 support could open the path towards the 200-day average at 7575.
-- Written by Fawad Razaqzada, Market Analyst
Follow Fawad on Twitter @Trader_F_R
How to trade with City Index
You can trade with City Index by following these four easy steps:
-
Open an account, or log in if you’re already a customer
• Open an account in the UK
• Open an account in Australia
• Open an account in Singapore
- Search for the company you want to trade in our award-winning platform
- Choose your position and size, and your stop and limit levels
- Place the trade
Latest market news
Yesterday 01:32 PM
Yesterday 09:35 AM
Yesterday 07:23 AM
Yesterday 04:48 AM
Yesterday 12:17 AM
July 25, 2024 10:39 PM
Latest FTSE 100 articles

July 10, 2024 11:55 PM

July 4, 2024 11:00 AM

June 19, 2024 12:00 PM
March 11, 2024 04:30 PM