

The FTSE 100 has fallen for seven consecutive sessions, marking its longest losing streak since mid-2019. The index is trying to end that rout today.
RS Group is the biggest gainer this morning, up over 3% at 726.80p after being upgraded to Outperform by BNPP Exane, which signalled there is significant upside potential with its target price of 965p.
Anglo American, Rio Tinto and Glencore are all up over 1% today, with Asian markets having found some support on hopes that the Chinese government is making more significant interventions to revive the economy.
That is allowing them to shrug off results out from Australian giant BHP Group, which posted a sharper drop in earnings than anticipated in the recently-ended financial year as commodity prices weakened, resulting in its dividend being cut by more than half. CEO Mike Henry said the situation in China, a major buyer of commodities, was “a bit uncertain” and admitted that the government’s efforts to stimulate the economy was “not translating as effectively into changes on the ground as certainly we were anticipating” while speaking on Bloomberg TV.
FTSE 100 analysis: Winners and losers
Below is a table outlining the biggest movers in the FTSE 100 in early trade today:
|
Winners |
% |
Losers |
% |
|
RS Group |
3.4% |
Pershing Square |
-0.5% |
|
Anglo American |
1.7% |
AB Foods |
-0.4% |
|
Fresnillo |
1.7% |
Unilever |
-0.4% |
|
CRH |
1.7% |
F&C Investment Trust |
-0.4% |
|
Glencore |
1.5% |
BP |
-0.3% |
|
Rolls Royce |
1.5% |
Phoenix Group |
-0.3% |
|
Antofagasta |
1.5% |
Haleon |
-0.3% |
|
Kingfisher |
1.5% |
Rentokil |
-0.3% |
|
Centrica |
1.4% |
Ocado |
-0.2% |
|
Endeavour Mining |
1.3% |
Shell |
-0.2% |
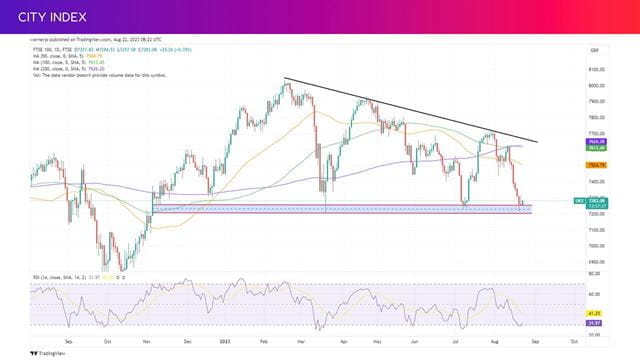
FTSE 100 outlook: Where next?
The FTSE 100 has been setting a series of lower-highs since peaking in February, but has found a reliable support at 7,257 to 7,206. Buyers have returned to the market the last eight times it has reached this level and that is proving true again today. The fact the RSI also slipped into oversold territory at this level in March, July and this week also reinforces the idea that this is as low as sellers can push the index for now.
We have seen the index rally every time it has rebound from these levels over the past eight months, although it is no longer able to set higher-highs as the falling trendline that can be traced back to February continues to provide resistance. This signals that sellers are returning to the market earlier and buyers are losing steam early each time. We could see the index return back to the trendline if this pattern continues. The pinbar we saw yesterday showed buyers experienced a strong rejection when they tried to push the price higher, so it will be interesting to see if they can make more progress today or whether sellers will keep the upper hand.
On the downside, a close below 7,257 would mark a new lower-low. Any slip below 7,200 could signal the start of a sharper reversal.
How to trade the FTSE 100
You can trade the FTSE 100 with City Index in just four easy steps:
- Open a City Index account, or log-in if you’re already a customer.
- Search for ‘UK 100’ you want in our award-winning platform
- Choose your position and size, and your stop and limit levels
- Place the trade
Or you can practice trading risk-free by signing up for our Demo Trading Account.
Latest market news
Yesterday 01:32 PM
Yesterday 09:35 AM
Yesterday 07:23 AM
Yesterday 04:48 AM
Yesterday 12:17 AM
July 25, 2024 10:39 PM
Latest FTSE 100 articles

July 10, 2024 11:55 PM

July 4, 2024 11:00 AM

June 19, 2024 12:00 PM
March 11, 2024 04:30 PM