


Elliott wave theory may be 90 years old, but it still has its devotees today. Learn how to implement Elliott waves in your trading here.
- What is Elliott wave theory?
- What is the Elliott wave pattern?
- How to trade Elliott waves
- Do Elliott waves work?
What is Elliott wave theory?
Elliott wave theory is a principle first proposed by Ralph Nelson Elliott in the 1930s. After studying stock index charts, he noticed that they tended to move in waves – with some conforming to the prevailing trend, and some running counter to it.
Elliott put these patterns down to investor psychology, deciding that mass sentiment moved in predictable patterns.
Crucially, Elliott’s wave patterns are ‘fractal’, which means the waves Elliott noticed repeat themselves over any timeframe. If you look at a one-year Dow Jones (Wall Street) chart, you should see the Elliott wave pattern – then still see it if you zoom all the way down to a tick chart, according to the theory.
What is the Elliott wave pattern?
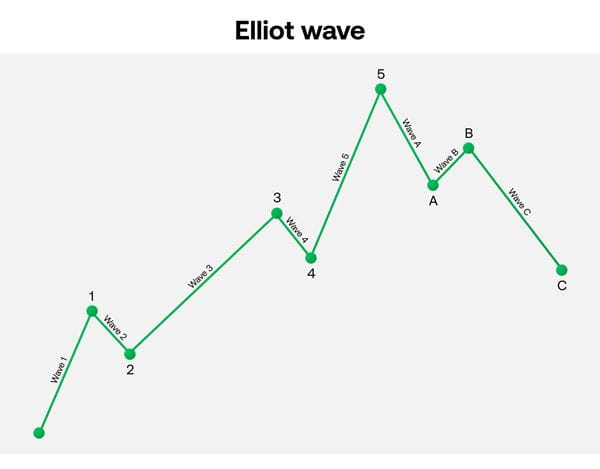
The Elliott wave pattern is the set of moves that Elliott noted formed the basis of stock market price action. The pattern is formed of eight waves, with each moving in the opposite direction to the previous one:
- The first five waves move in the direction of the current trend overall. This is called the motive phase
- The final three waves move against the current trend overall. This is called the corrective phase
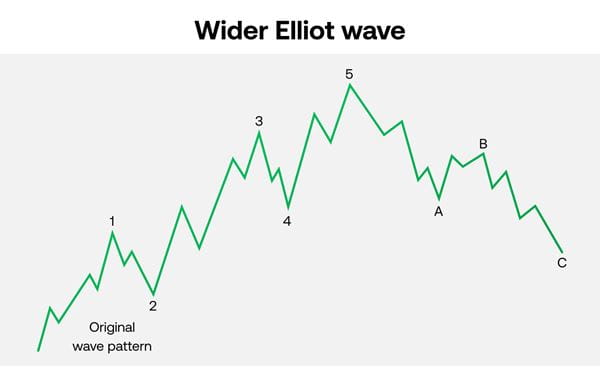
Once completed, the motive phase should then go on to form the first wave on another, wider pattern. This continues infinitely, giving the pattern its fractal nature.
Learn more about technical patterns.
You can see how this pattern might play out below. The numbered points mark the end of the motive waves, and the lettered ones the end of the corrective waves. And each successive wave moves in the opposite direction to the one before it.
If we zoom out, we can see how the above pattern could form part of a wider set of waves. Notice that the moves with the trend are made up of five waves, and the moves against it are three waves.
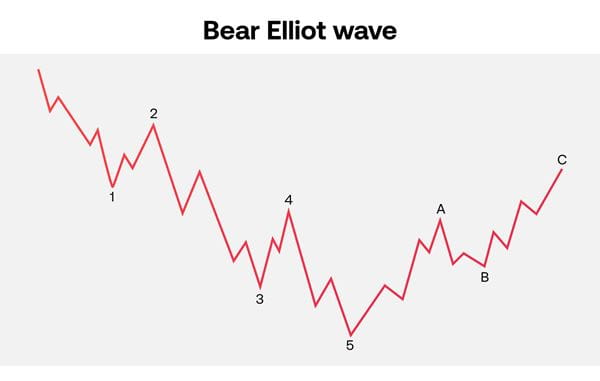
What if an Elliott wave forms on a bear market? In that case, the motive phase would be downward and the corrective one upward.
Each wave that moves against its phase (two and four in the motive, and B in the corrective) should not be bigger than the one that moves with the phase before it. So:
- Wave two can’t be a bigger move than one
- Wave four can’t be bigger than three
- Wave B can’t be bigger than A
How to trade Elliott waves
To trade Elliott waves, you first determine whether your market is in a bull or bear trend, and then whether it is in the motive or corrective phase of the pattern. From there, you can work out which wave the market is currently in and make predictions about where it might head next.
The theory is particularly popular among swing traders, who seek to capitalise from the movements within wider trends. A swing trader might look to buy an upwardly trending market while it’s in the motive phase, for example, and then sell once the corrective takes over.
However, implementing an Elliott wave strategy can be tricky in practice; identifying waves and phases is a skill that takes time to master. That’s why it’s always a good idea to start with a demo account which gives you virtual funds to try out Elliott wave trading on real markets.
Open your City Index demo here.
Start trading Elliott waves
Once you’re ready to move up to live trading, follow these steps to get started:
- Open your City Index account and add some funds
- Log in to our award-winning Web Trader platform or download our mobile trading app
- Search for Elliott waves on TradingView charts
- Choose to buy to go long, or sell to go short
Do Elliott waves work?
Elliott waves can work, and practitioners of the theory have had some notable successes. Elliott himself hit the headlines by predicting a stock market nadir in 1935, and two authors of a book on Elliott wave predicted a stock boom in the 1980s and the crash in 1987.
However, unlike true technical strategies and patterns, Elliott wave theory is highly subjective in its application. There aren’t many rules governing each wave, and they can last any length of time.
This is why beginner traders can stumble when attempting to implement Elliott wave and often end up looking for alternative trading strategies with easy-to-follow sets of rules.
Elliott wave and Fibonacci
Due to the subjectivity of Elliott wave formations, many traders combine them with Fibonacci theory for a more comprehensive trading system. Specifically, you can use Fibonacci retracements to predict when the corrective waves (two, four and B) might end, and Fibonacci extensions on the motive waves (one, three, five, A and C).
Wave two, for example, might be 50%, 61.8%, 76.4% or 85.4% of wave one, because those are the classic Fibonacci retracement levels above 50%. Wave three is then an extension of wave one, so might reach 161.8% of it.
To plot Fibonacci levels on an Elliott wave, you can use the Fibonacci drawing tool in the City Index platform.
Elliott wave FAQs
What are the Elliott wave rules?
The Elliott wave rules are that markets move in eight waves – five that move in line with the major trend overall, and three that move against it overall. Each wave is a move in the opposite direction to the one that preceded it, and the retracements within a phase cannot be bigger than the waves before them.
In addition:
- Wave three must be longer than one or five
- Wave four cannot ever overlap with wave one
What is the Elliott wave oscillator?
The Elliott wave oscillator is a technical indicator that’s inspired by Elliott’s theory. It uses two moving averages to plot impending switches between motive and corrective waves.
Learn more about technical indicators.
Latest market news
Yesterday 03:00 PM
Yesterday 01:12 PM
Yesterday 11:14 AM
Yesterday 08:28 AM
April 24, 2024 03:30 PM
Latest Financial market insight articles
March 26, 2024 04:11 AM
November 16, 2023 10:23 AM
November 13, 2023 11:05 AM
October 25, 2023 01:45 PM