

- WTI crude oil trades at 2024 highs
- The 50-day moving average is about to cross the 200-day moving average from below, generating a ‘Golden Cross’
- Prices have typically rallied when golden crosses have occurred in the recent past, although there are some caveats to consider
The overview
WTI crude oil has surged to the highest level since October, underpinned by bullish fundamental and technical factors. The rally has seen the 50-day moving average flick sharply higher, putting it on track to generate a Golden Cross as it moves above the 200-day moving average.
History suggests this may fuel further gains despite the price sitting in overbought territory.
The background
Crude has a lot going right for it right now, explaining why prices have surged to the highest level since October 2023.
Supply discipline from major OPEC producers and Russia is helping to tighten the market, as is ongoing resilience from major economies, keeping demand firm. Until that backdrop changes, it’s hard to see the prevailing trend reversing meaningfully, especially with geopolitical tensions in the Middle East remaining elevated.
It’s not just fundamentals working in oil's favour, either. The charts are also chiming in with the upswing in prices triggering fresh waves of buying on each bullish break, helping to keep momentum moving to the upside.
Having broken long-running downtrend resistance cleanly in March, WTI has subsequently smashed horizontal resistance at $83 before doing away with $85.50. With the price continuing to trend higher, it’s seen the 50-day moving average turn sharply higher towards its 200-day equivalent, leaving it on track to generate another bullish technical signal: a golden cross.
The last time the 50-day moving average crossed the 200-day moving average from below in 2023, it triggered a more than 22% rally, pushing WTI to levels not seen since Russia’s invasion of Ukraine.
While the predictive powers of the golden cross are imperfect, from 2016 onwards, whenever the gap between the two averages was more than 5% prior to the crossing occurring, the price has been higher two weeks later on four of five occasions. The only exception was in late 2020 when the price slid 20% following the crossing before embarking on a near 300% rally.
So the cross does have recent form on the board, pointing to the potential for further gains despite the price sitting in overbought territory on RSI.
The trade setup
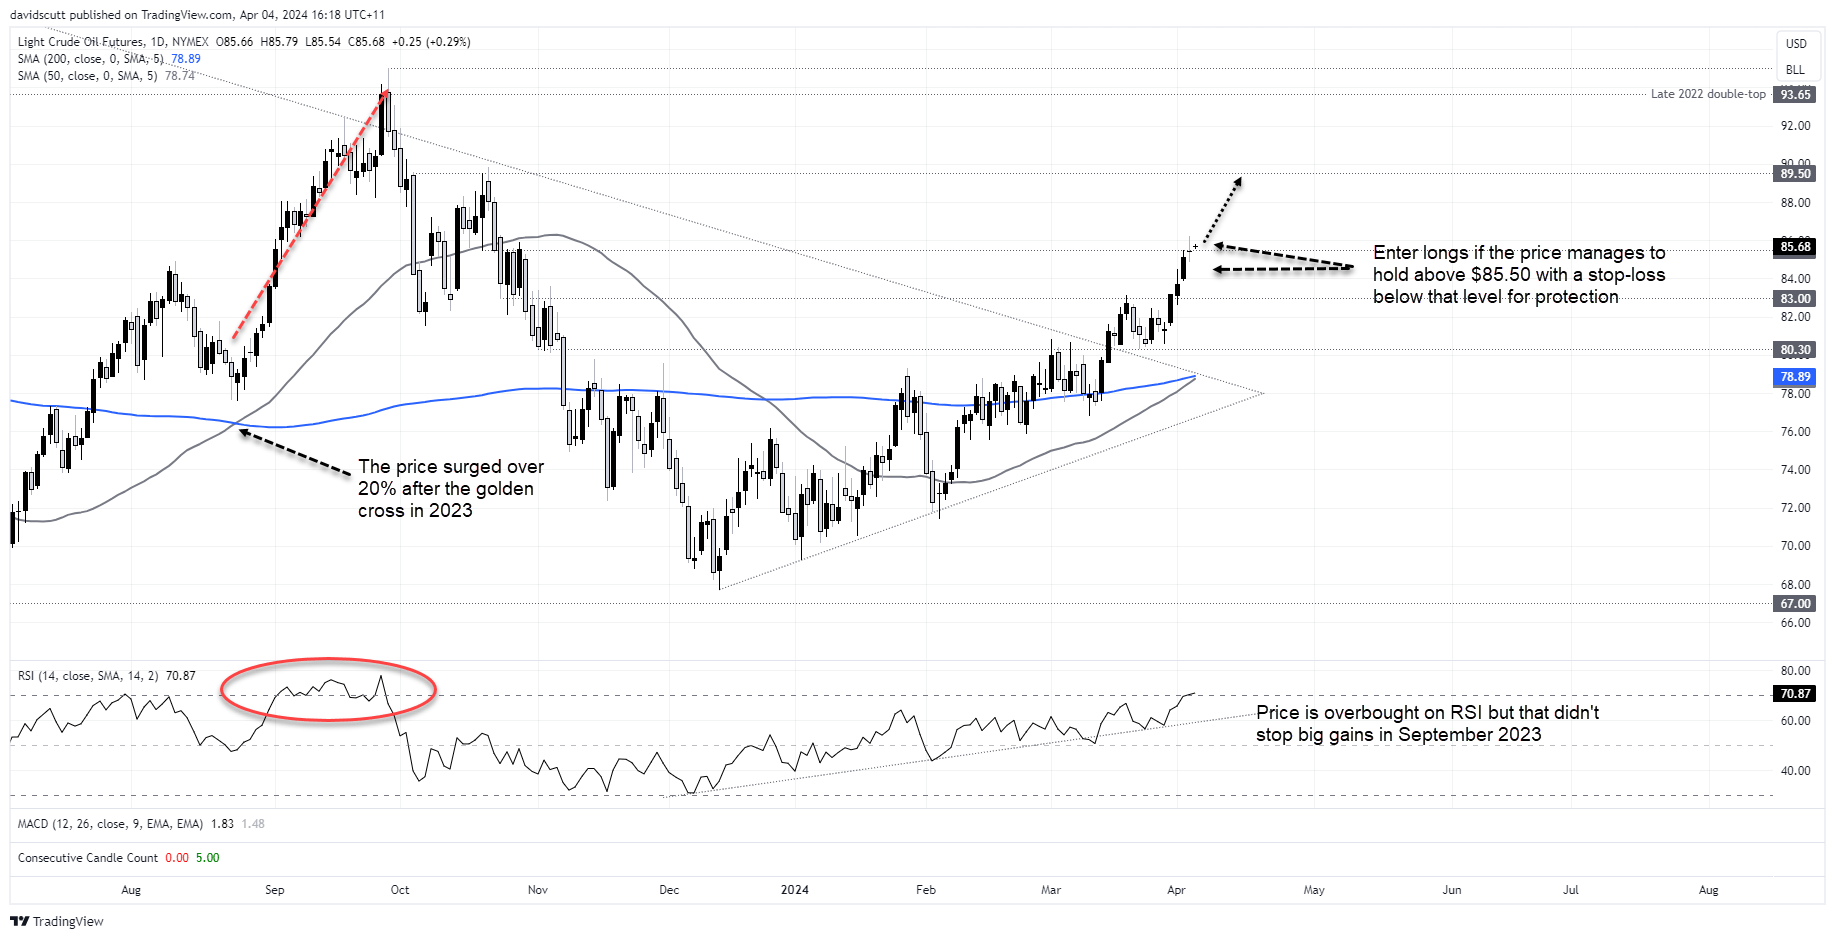
Having broken resistance at $85.50, if the price manages to hold above it near-term it will provide a decent setup for traders, allowing for long positions to be established above with a stop-loss order below to protect against a reversal.
There’s no major visible resistance on the charts until $89.50, although the price did some work around $88 back in September last year. They’re two potential upside targets. Above, $93.65 and $95 are the next topside levels to watch. If the price moves in your favour, you could move your stop-loss order up to entry point, allowing for a free shot at upside.
While the price is overbought using RSI on a daily timeframe, as seen in September last year, that is not necessarily an impediment to further gains.
The wildcards
Past performance is not indicative of future returns, so just because the golden cross has delivered gains in recent times doesn’t mean it will now.
Geopolitical tensions in the Middle East are a huge wildcard, holding the power to move prices significantly depending on near-term news flow. Therefore, supply side factors screen as far more important for the near-term price trajectory than the demand side of the equation.
-- Written by David Scutt
Follow David on Twitter @scutty
How to trade with City Index
You can trade with City Index by following these four easy steps:
-
Open an account, or log in if you’re already a customer
• Open an account in the UK
• Open an account in Australia
• Open an account in Singapore
- Search for the market you want to trade in our award-winning platform
- Choose your position and size, and your stop and limit levels
- Place the trade
Latest market news
Yesterday 01:32 PM
Yesterday 09:35 AM
Yesterday 07:23 AM
Yesterday 04:48 AM
Yesterday 12:17 AM
July 25, 2024 10:39 PM
Latest Crude Oil articles

July 25, 2024 05:30 PM
July 18, 2024 10:00 AM

July 16, 2024 12:09 PM
July 15, 2024 07:18 AM