August 19, 2021 3:39 PM
Crude oil driving USD/CAD and USD/NOK
Canadian inflation data yesterday showed that CPI had risen to 3.7% YoY in July vs 3.1% in June. This was higher than the expected 3.4% and the highest rate since May 2011. But does it matter to USD/CAD traders? Nah.
The Norges Bank (Norway) met earlier today and held interest rates unchanged, as expected, at 0.00%. However, they indicated that they will most likely raise rates in September. Does it matter to USD/NOK traders? Nope.
As both Canada and Norway are oil export-led economies, the main driver of these fx pairs recently has been the steep selloff in Crude Oil.
On a longer-term daily USOIL chart, price has risen from 0.00 on April 20th, 2020 to a recent high of 76.97 on July 6th, 2021, testing the highs from October 2018. With the progression of the move higher, USOIL formed an ascending wedge as it approached 76.97. Price finally broke below the ascending wedge on July 19th and failed to hold the retest of the bottom trendline. Since August 2nd, USOIL is down roughly 15%. However, a confluence of support sits just below between the 200 Day Moving Average at 60.56, the 38.2% Fibonacci retracement from the November 4th, 2020 lows to the July 6th highs near 60.39 and horizontal support at 61.90.
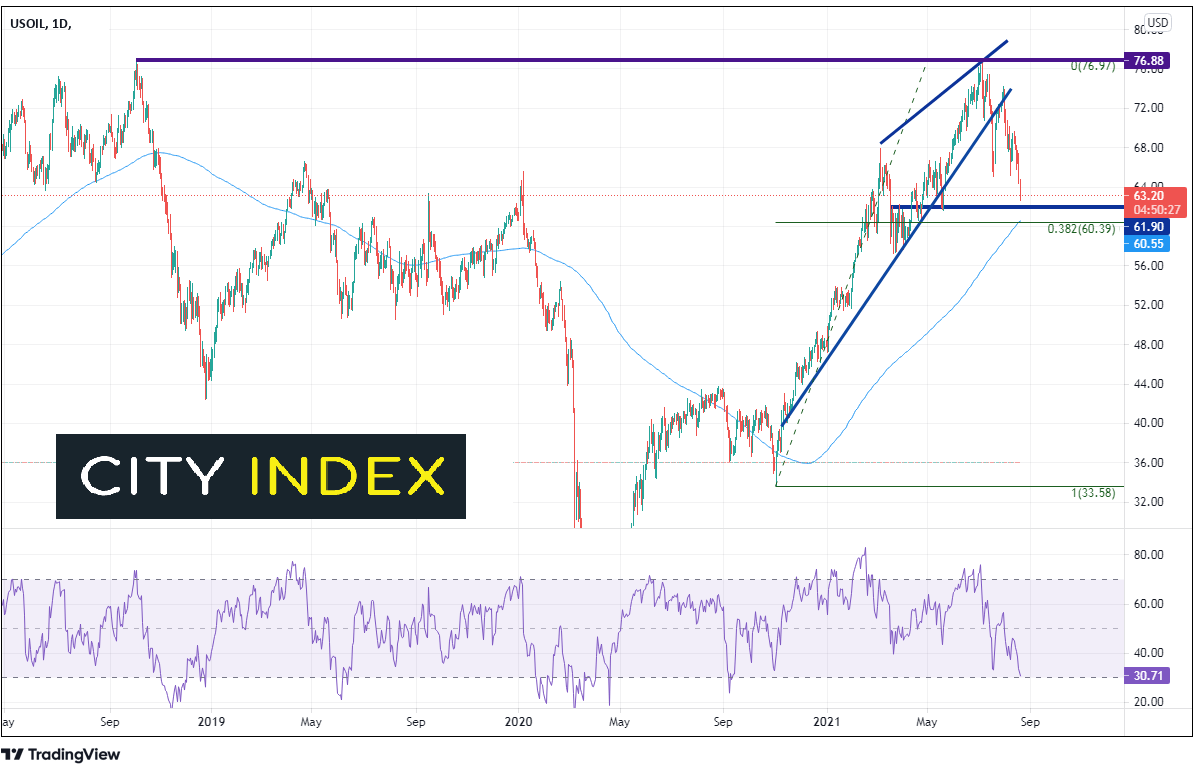
Source: Tradingview, StoneX
If USOIL does hold support, there is a good chance that USD/CAD will move lower. And as Matt Weller wrote about recently, our internal data shows a majority of traders are long the pair. Notice that the correlation coefficient at the bottom of the 240-minute chart is -0.90. A reading below -0.80 is considered a strong negative correlation. Also notice that the RSI is at 85.24. Anything above a reading of 70 is considered overbought may be ready for a pullback. If crude moves higher, there is current support in USD/CAD at the longer-term upward sloping trendline near 1.2775, then previous support near 1.2675. However, if crude continues to move lower, resistance is near current levels 1.2813 and then horizontal resistance at 1.2882.
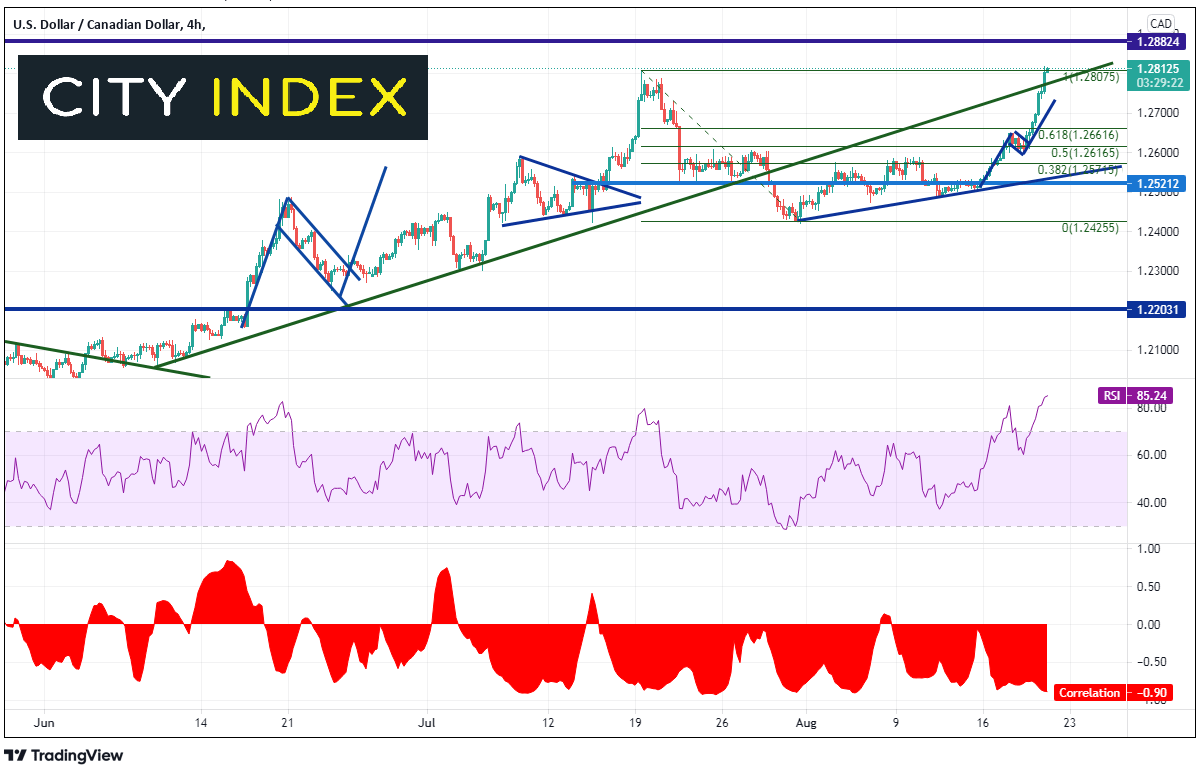
Source: Tradingview, StoneX
The 240-minute chart of USD/NOK shows a similar picture to that of USD/CAD. The correlation coefficient is -0.85. Again, there is a strong negative relationship between the 2 assets. The RSI is 80.17. As with USD/CAD, USD/NOK is overbought and may be ready for a pullback. If crude oil bounces, horizontal support for USD/NOK is at 8.9570. Further support is at the bottom of the flag and horizontal support near 8.8624, and then the August 16th lows at 8.7770. Below there, price can fall back to the bottom of the flagpole near 8.6610. If crude oil continues lower, strong resistance crosses at the confluence of the July 20th highs and upward sloping trendline near 9.1044.
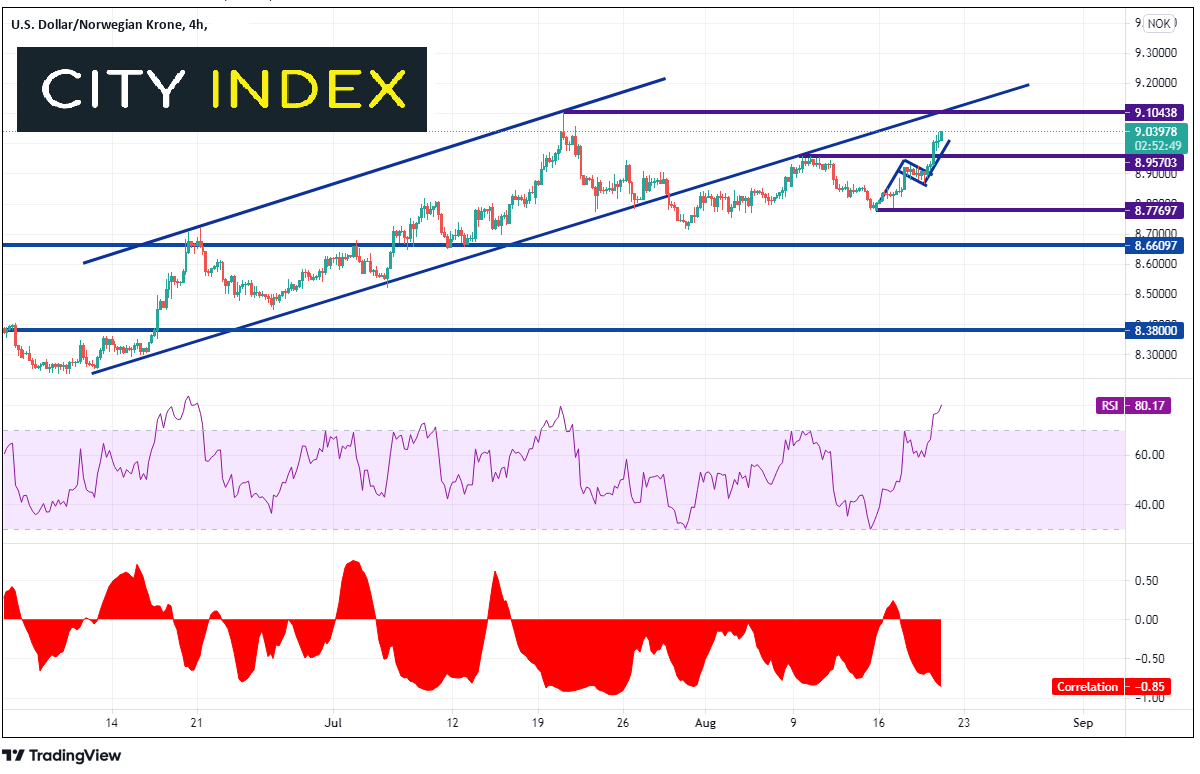
Source: Tradingview, StoneX
Both USD/CAD and USD/NOK currently have a high negative correlation with USOIL. Therefore, if oil can hold support and move higher, USD/CAD and USD/NOK should move lower. However, if oil continues to move lower, watch out! USD/CAD and USD/NOK can put in new highs for the year!
Learn more about forex trading opportunities.
Latest market news
Yesterday 01:32 PM
Yesterday 09:35 AM
Yesterday 07:23 AM
Yesterday 04:48 AM
Yesterday 12:17 AM
July 25, 2024 10:39 PM
Latest Crude Oil articles

July 25, 2024 05:30 PM
July 18, 2024 10:00 AM

July 16, 2024 12:09 PM
July 15, 2024 07:18 AM