

WTI, Brent Crude Oil Key Points
- The bullish supply-demand picture from the third quarter has reversed, driving crude oil prices sharply lower so far this week.
- WTI is testing the 61.8% Fibonacci retracement of its mid-year rally, with a break below there potentially targeting $70 next.
- Brent has already broken below its own 61.8% Fibonacci retracement, and bears are eyeing $77 next.
WTI, Brent Crude Oil Fundamental Analysis
When analyzing oil prices, it always comes back to fundamental supply and demand.
Through the third quarter of this year, when the US economy was growing at a far better pace than expected and traders were concerned about the potential for supply disruption from conflicts in the Middle East, oil prices surged by nearly 30%.
Now though, as we’ve shifted into the fourth quarter, those trends have reversed. While the humanitarian cost of the Israel-Hamas war continues to grow, analysts are increasingly confident that it won’t spread into a broader regional conflict that disrupts oil production. Meanwhile, reports out of Russia suggest that the country may be exporting more oil than expected after the country vowed to voluntarily reduce shipments by 300k bpd until the end of the year. At the same time, recent ISM figures from the US, Eurozone, and China all missed expectations, suggesting that the global economy downshifted heading into the 4th quarter.
The supply-demand tide has clearly shifted in the oil market, and unless we see imminent signs that supply will be disrupted or accelerating growth in the global economy, crude prices are likely to remain under pressure.
Crude Oil Technical Analysis – WTI Daily Chart
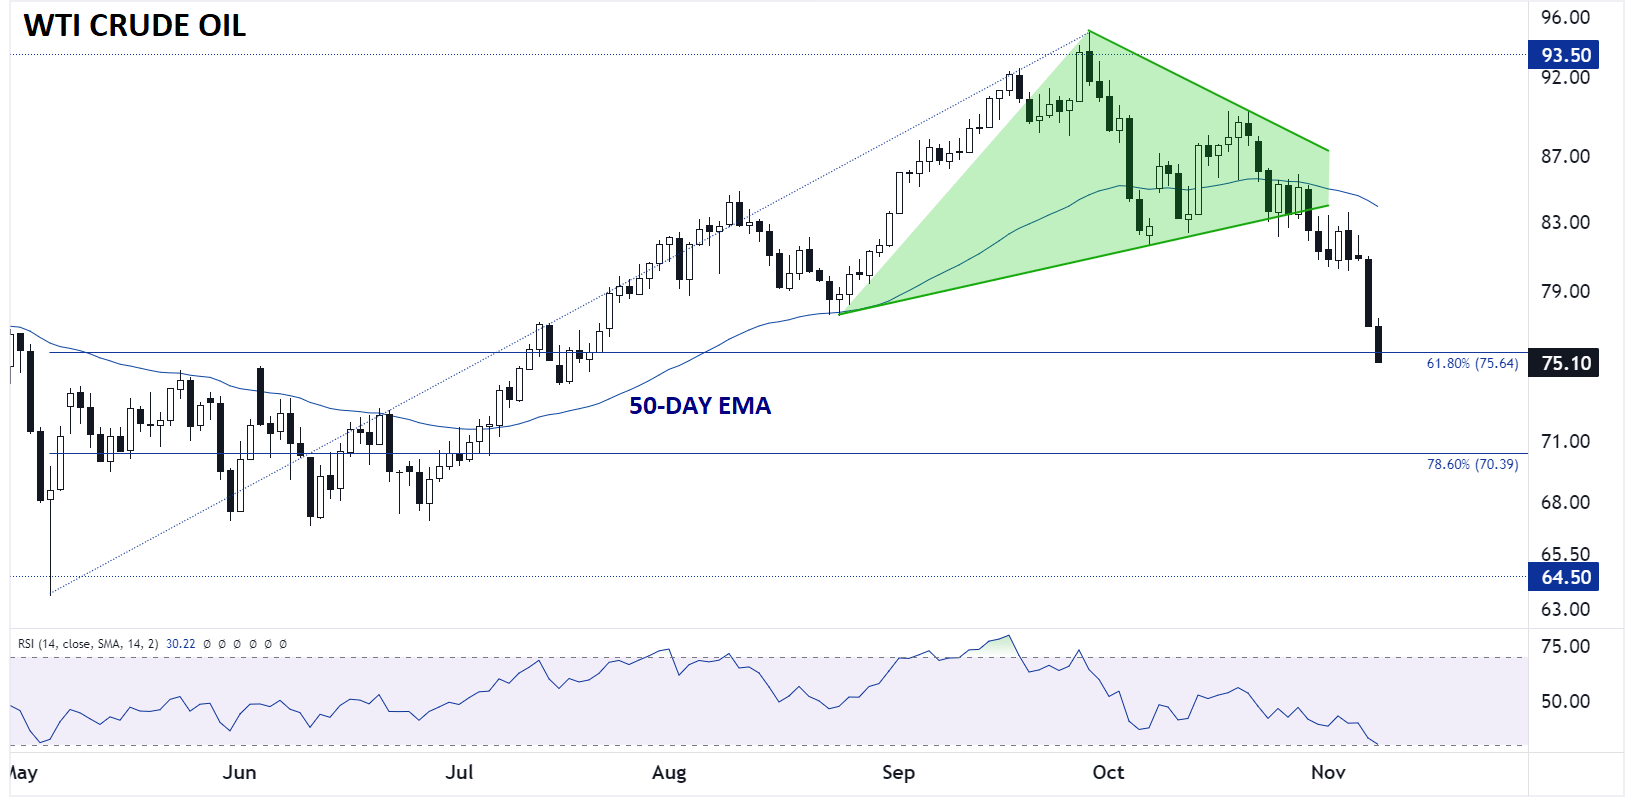
Source: TradingView, StoneX
As the chart above shows, WTI Crude Oil is in the midst of a strong selloff. After breaking down below a symmetrical triangle pattern in late October, WTI has been in freefall, with prices now testing the 61.8% Fibonacci retracement of the mid-year rally near $75.00. The 14-day RSI is testing oversold levels for the first time in eight months, so a brief bounce cannot be ruled out, but the dominant trend remains to the downside for a potential move toward the 78.6% Fibonacci retracement near $70 unless something major changes.
Crude Oil Technical Analysis – WTI Daily Chart
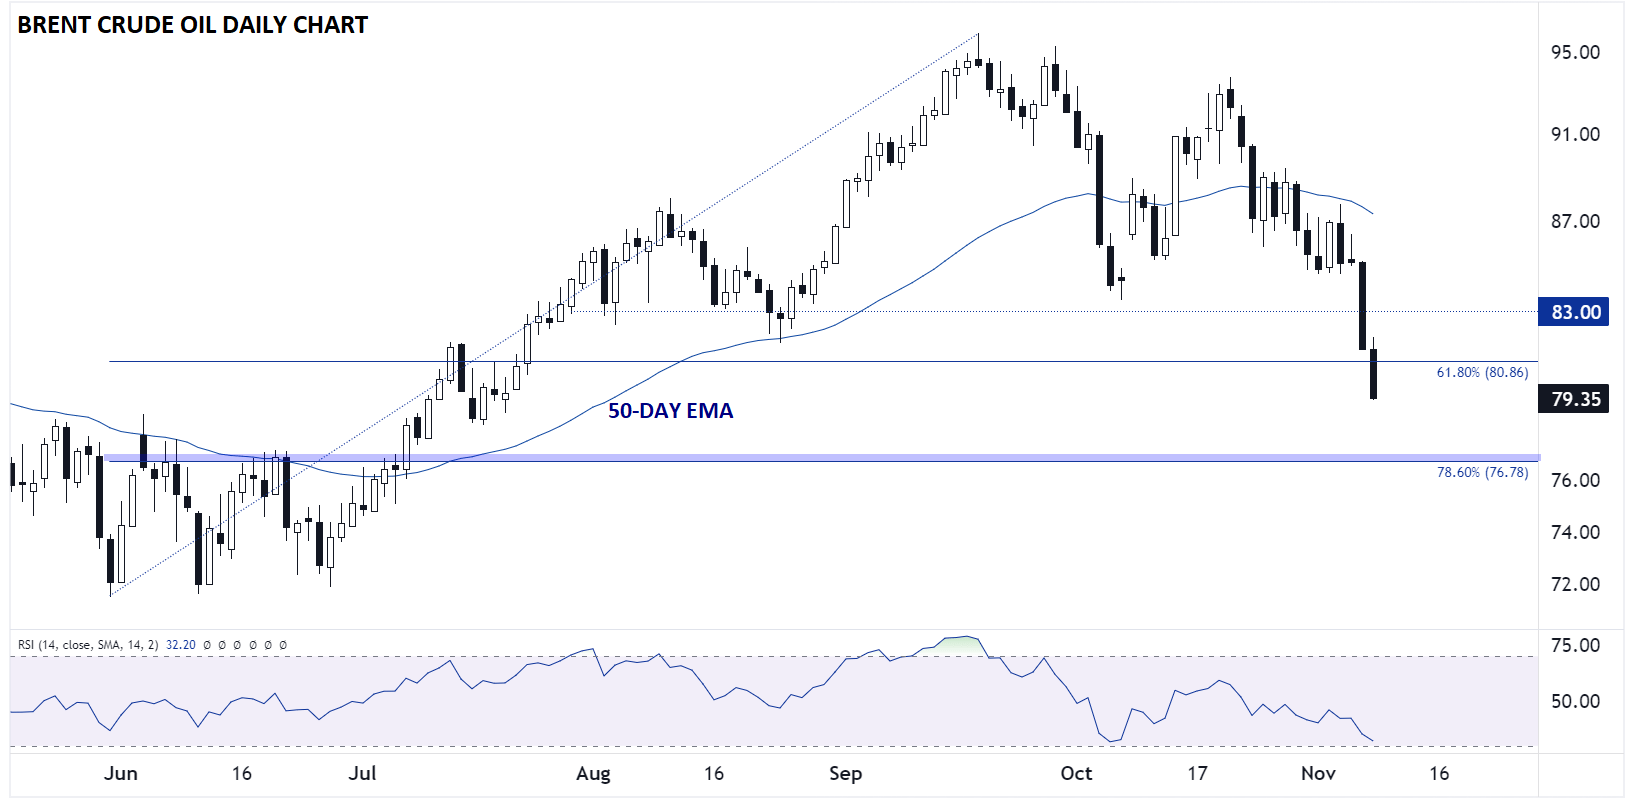
Source: TradingView, StoneX
Brent Crude Oil, the more global benchmark for oil prices, is seeing a similarly deep selloff of its own. Brent prices sliced straight through support at 83.00 yesterday, and the selling pressure has continued into today’s trade; in fact, Brent prices are trading below $80.00 for the first time since July! Moving forward, the 61.8% Fibonacci retracement has clearly been broken at this point, opening the door for a continuation down toward the 78.6% Fibonacci retracement near $77.00 next.
-- Written by Matt Weller, Global Head of Research
Follow Matt on Twitter: @MWellerFX
Latest market news
Yesterday 01:32 PM
Yesterday 09:35 AM
Yesterday 07:23 AM
Yesterday 04:48 AM
Yesterday 12:17 AM
July 25, 2024 10:39 PM
Latest Crude Oil articles

July 25, 2024 05:30 PM
July 18, 2024 10:00 AM

July 16, 2024 12:09 PM
July 15, 2024 07:18 AM