September 15, 2021 12:11 PM
Big move in Natural Gas; Highly Correlated to USD/RUB!
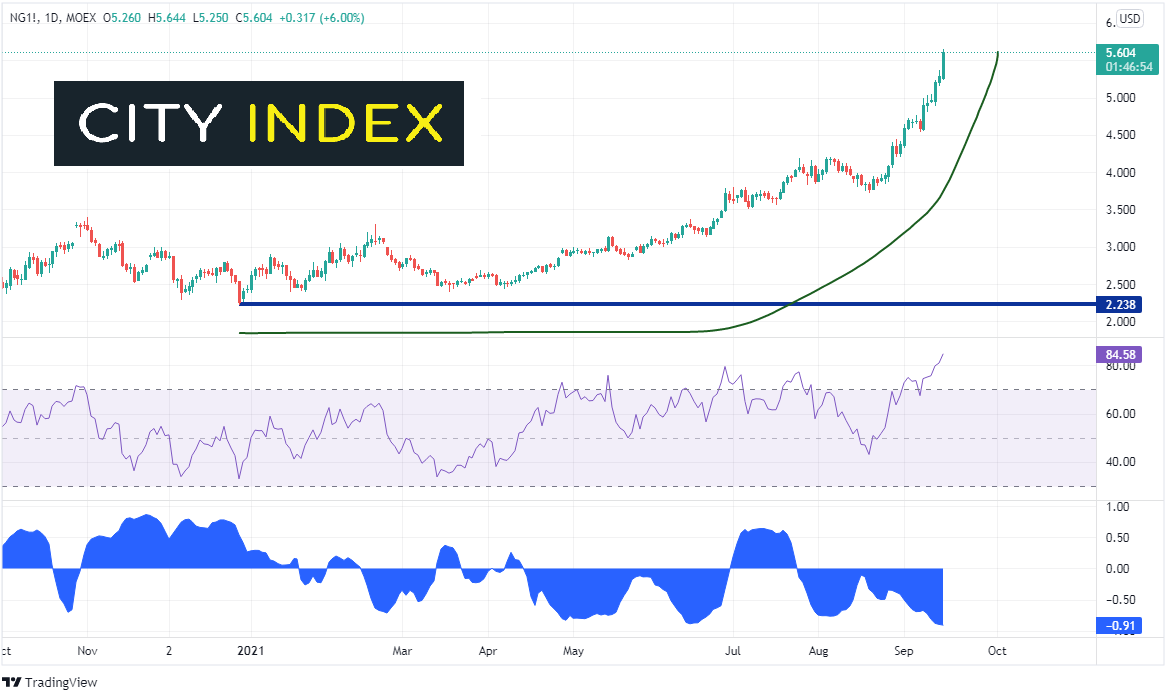
Natural gas (NG) has been on a tear lately. On December 28th, 2020, NG put in a low of 2.238. Since then, price is up nearly 150%, including a rise of nearly 50% alone in the past month. Uncertainties about Russia’s ability to provide Europe with enough natural gas this winter continue, as Nord Stream 2 may be delayed by on-going concerns in Germany. Natural Gas (and electricity prices in general) were pushed higher by a fire at a UK electricity plant, shutting it down (this raises demand for alternatives, such as Natural Gas). In addition, throw in a hurricane and a tropical storm in the US, which shut down a liquefied natural gas plant (LNG), and BOOM, a recipe for higher prices. True, the RSI is in overbought territory at 84.37, however RSI is not a useful indicator when price is moving parabolic.
Source: Tradingview, Stone X
Learn more about commodity trading opportunities.
If foreign exchange traders are looking to take advantage of this parabolic move in Natural Gas, it is best to look for currency pairs which are highly correlated to natural gas. If you trade on a daily timeframe, look no further than USD/RUB. Notice at the bottom of the chart above, the correlation coefficient is -0.91. A correlation coefficient of -1.00 means that the 2 assets move in opposite directions 100% of the time. We look at correlation coefficients above +0.80 or below -0.80 for strong correlations. The current reading of -0.91 between Natural Gas and USD/RUB is considered a strong negative correlation! Therefore, traders could expect USD/RUB to move lower if Natural Gas moves higher.
*Note that the correlation coefficient compares direction, not magnitude.
Trade USD/RUB now: Login or Open a new account!
• Open an account in the UK
• Open an account in Australia
• Open an account in Singapore
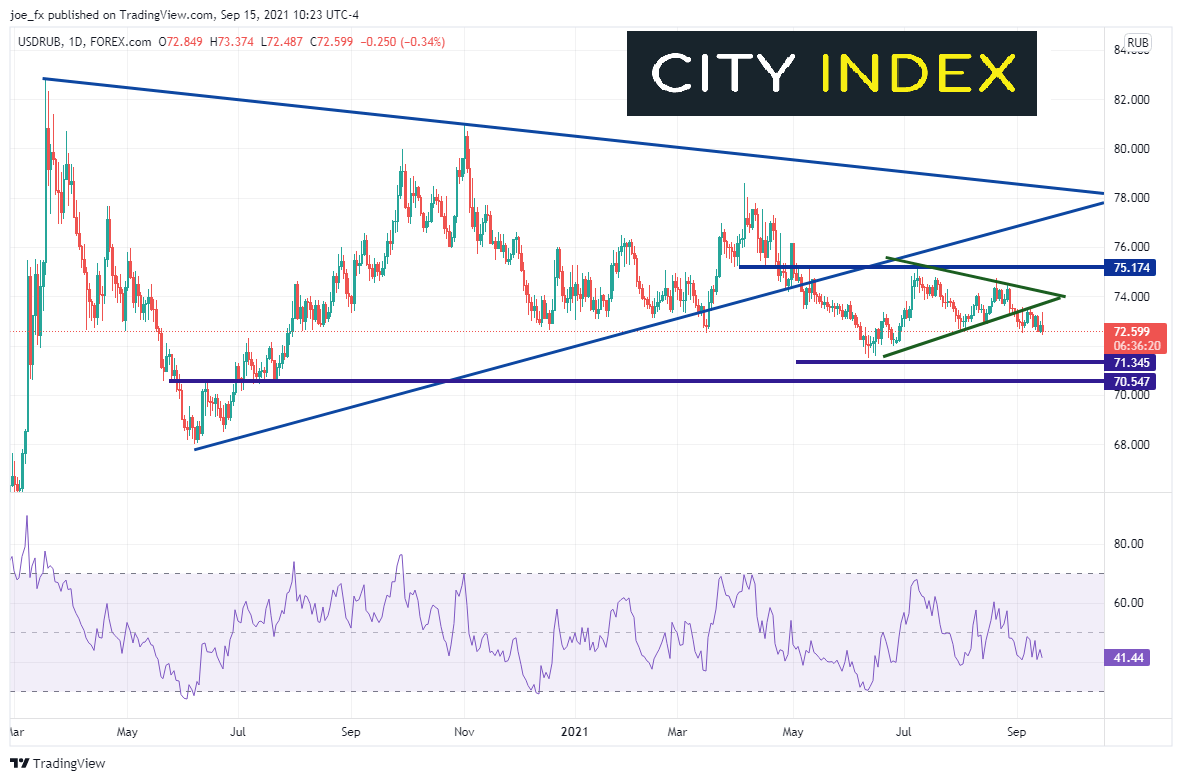
On a daily timeframe, USD/RUB had ben trading in a symmetrical triangle since the pandemic highs in March 2020. In early May 2021, price finally broke below the bottom trendline of the triangle near 74.20 and made a low of 71.55 on June 11th, before bouncing and retesting the bottom trendline of the triangle. In doing so, price formed a smaller symmetrical triangle in early July (green). Price broke below that triangle on August 31st near 73.25.
Source: Tradingview, Stone X
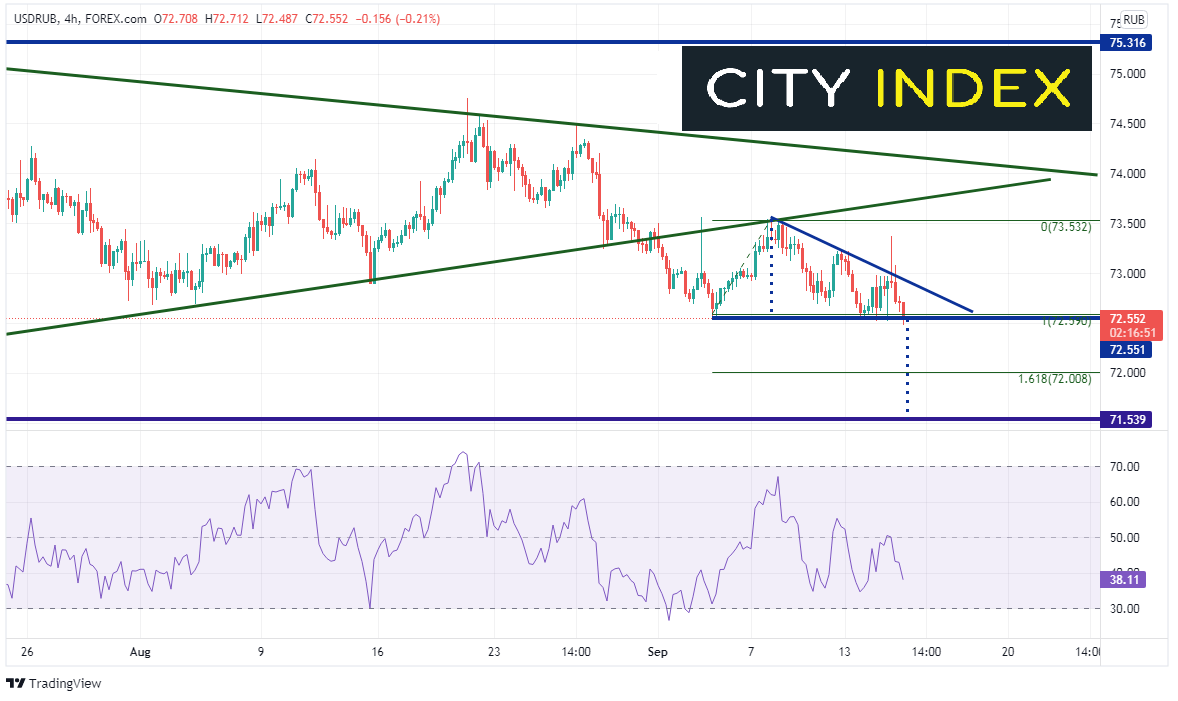
On a 240-minute timeframe, after USD/RUB broke below the smaller symmetrical triangle and moved lower, it retested the bottom trendline near 73.50 on September 7th and failed. The pair is now testing horizontal support at the September 3rd lows near 72.55. Notice that USD/RUB formed a smaller, falling triangle. The target for a falling triangle is the height of the triangle added to the breakdown, which is near horizontal support from June near 71.53! However, the pair must first break through the 161.8% Fibonacci extension from the September 3rd lows to the September 8th highs, near 72.00. Intra-day resistance is at the downward sloping trendline of the channel near 72.91, todays spike highs near 73.37, and the September 8th highs near 73.53.
Source: Tradingview, Stone X
Natural Gas has been moving higher since the beginning of the year, and now appears to have turned parabolic. Because of its high negative correlation to USD/RUB, foreign exchange traders could look to take advantage of the move via this currency pair.
Learn more about forex trading opportunities.
Latest market news
Yesterday 01:32 PM
Yesterday 09:35 AM
Yesterday 07:23 AM
Yesterday 04:48 AM
Yesterday 12:17 AM
July 25, 2024 10:39 PM
Latest RUB articles

November 17, 2022 08:39 PM
February 28, 2022 06:54 AM

February 22, 2022 03:03 AM

February 21, 2022 09:26 PM