AUD USD The biggest bullish breakout that no one s talking about
As I return to the desk after a much-needed vacation, I’m struck by the big risk-on move markets have seen over the last couple of […]
As I return to the desk after a much-needed vacation, I’m struck by the big risk-on move markets have seen over the last couple of […]
As I return to the desk after a much-needed vacation, I’m struck by the big risk-on move markets have seen over the last couple of weeks: US equities are up nearly 10% from the mid-February lows, Oil prices (WTI) have surged by over 40% in the last month, and the (relatively) high-yielding currencies have seen strong bullish moves of their own. While the economic data of late has been mixed, prominently featuring a strong US jobs report on Friday and a shockingly weak Chinese trade balance figure in yesterday’s Asian session, investor sentiment has nonetheless improved markedly.
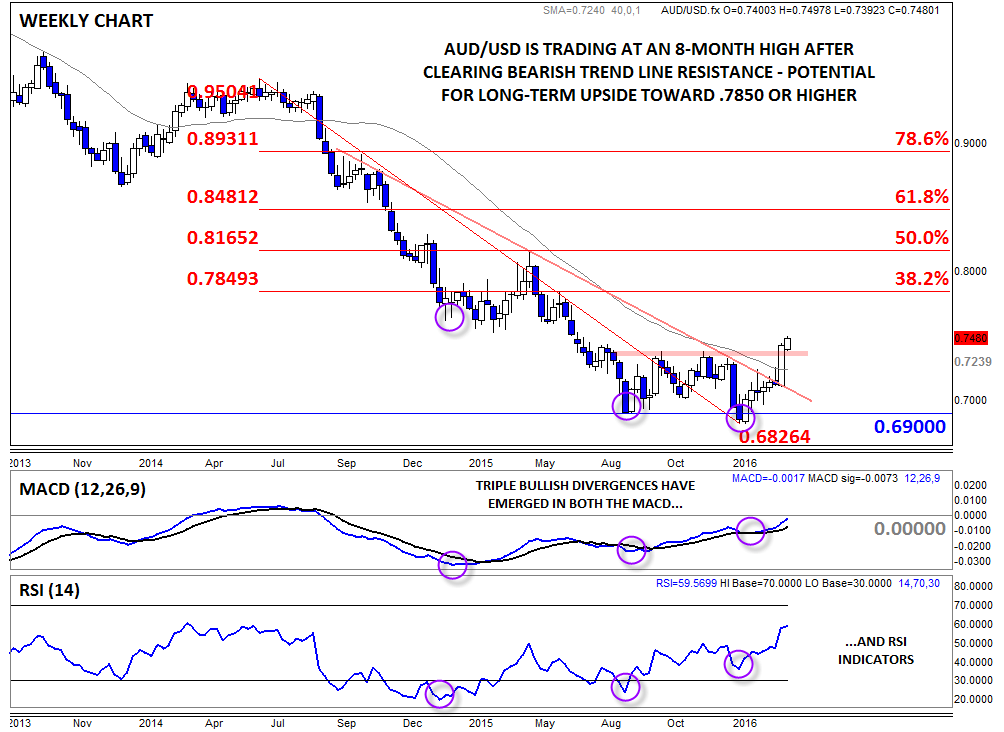
In the FX market, one of the biggest moves (both in terms of absolute pips and significance) has emerged in AUD/USD. After collapsing from above parity in 2013, the pair carved out a 500-pip range from .6900 to .7400 over the last six months. Last month, the unit broke above its 16-month bearish trend line near .7200, and after last week’s big bullish move, the pair is trading at an 8-month high for the first time in years. As the weekly chart below shows, both the MACD and RSI indicators are trending higher after forming triple bullish divergences, a strong sign that the long-term momentum is shifting in favor of the bulls.
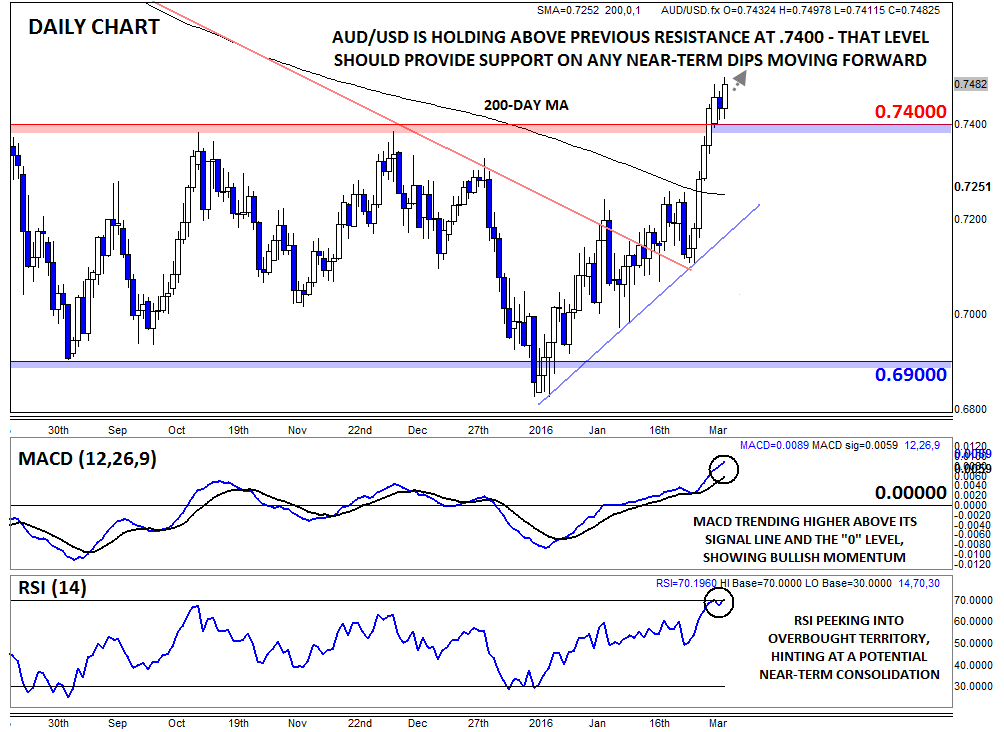
Zooming in to the daily chart puts last week’s big breakout into better perspective. AUD/USD has seemingly established itself solidly above previous resistance at the .7400 handle; moving forward, this level could now provide any support on near-term dips. With the MACD trending solidly higher above both its signal line and the “0” level, it’s clear that the medium-term momentum is pointing higher, though the overbought reading in the daily RSI indicator, not to mention the still downward-trending 200-day MA, suggests that some near-term consolidation would be healthy for Aussie bulls.
Moving forward, higher rates will be favored as long as AUD/USD remains above .7400. To the topside, there’s not much in the way of meaningful long-term resistance nearby. As the weekly chart (above) shows, the next Fibonacci retracement level sits near .7850, and beyond that the .8000 handle could draw bulls’ attention.