
S&P500 Forecast: SPX rebounds as big tech recovers & inflation is in focus
Article
Today 2:32 PM


When you analyse charts, you’ll see certain formations crop up again and again. Some traders use these to enter and exit trades. So, we’re going to explore the chart patterns you should know and recognise.
A chart pattern is a set price action that is repeated again and again. The idea behind chart pattern analysis is that by knowing what happened after a pattern in the past, you can take an educated guess as to what might happen when it appears again.
The outcome of each chart pattern will vary depending on whether it appears in volatile or calm markets, and in bullish or bearish environments. But broadly speaking, there are three types of pattern you’ll come across:
Now that we know the basics, let's look at some of the most common chart patterns in technical analysis.
Ascending and descending staircases are probably the most basic chart patterns. But they’re still important to know if you’re interested in identifying and trading trends.
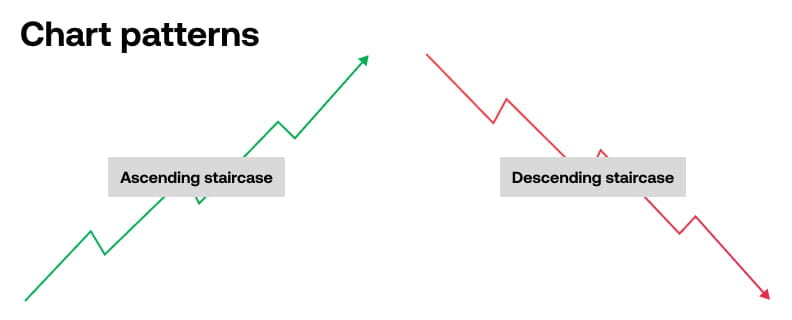
The ascending staircase appears in an uptrend when there is a series of higher highs and higher lows. This is a bullish trend. Traders will consider going long until the uptrend comes to an end. In an uptrend, a trader could buy the dips or the breakouts of recent highs.
When markets are forming lower lows and lower highs this can be considered a downtrend and forms a descending staircase. In this phase, traders would consider trading on the short side of the market. And in a downtrend, a trader could sell the rallies or breakouts of recent lows.
The ascending triangle is a chart pattern that’s created when a horizontal set of highs – a resistance level – is met by an ascending set of lows.

It is a continuation pattern that signifies where a market could break out into an uptrend. Usually, traders will confirm the pattern with volume indicators. If there’s rising interest, then the price is more likely to continue upwards.
Although the price does typically break out in the same direction as the prevailing trend, it doesn’t always happen. Ascending triangles can also indicate the start of a downtrend if price breaks lower or volume declines.
The descending triangle is the opposite. It occurs when a horizontal set of lows – or a support level – is met by a descending set of highs.

It’s also considered a continuation pattern, telling us that the market is likely to breakout lower, making it a bearish signal.
Symmetrical triangle patterns occur when two trend lines approach one another. A support line within an uptrend converges with the resistance line of a downtrend.

It’s still considered a continuation pattern because the market usually continues with the prevailing trend. However, if there is no clear trend before the pattern forms, it’s a bilateral pattern and the price could go in either direction. Once a breakout in either direction is confirmed, it suggests that the trend is likely to continue in that direction.
A flag pattern is created when the support and resistance lines run parallel to each other, appearing as a sloping rectangle. It culminates in a breakout in the opposite direction to the trendlines.
Although it can be considered a reversal, it’s usually classed as a continuation pattern because they tend to occur before the previous trend continues. Think of it in three parts: a strong directional move, followed by a slow counter trend – the ‘flag’ – and a breakout.

A wedge pattern is similar to a flag, except that the lines tighten toward each other. As the pattern progresses, it coincides with a decline in volume.

At the end of the wedge, the price often breaks out in the opposite direction to the trend – making it a reversal pattern.
A wedge pattern can either be rising or falling. For a rising wedge pattern, the result would be that the market breaks out downward, passing the support level. Traders can make bearish trades by selling the asset. For a falling wedge, the price breaks through a resistance level to start an uptrend and traders can go long.
Some traders even choose to enter short-term trades within the wedge pattern, taking smaller profits from the oscillations between support and resistance.
A double top pattern is formed after a market price reaches two highs consecutively with small declines in between. It forms an ‘M’ shape on the chart.

It’s a bearish reversal pattern, so it’s thought that the asset’s price will fall below the support level that forms at the low point between the two highs. It’s crucial to confirm this support level, as basing your trade solely on the formation of the two peaks can cause a false reading.
Often, the second top won’t be quite as high as the first, as it’s signalling the end of buying pressure.
A double bottom is the opposite. It’s formed when a market’s price has made two attempts to break through a support level and failed. In between, there has been a temporary price rise to a level of resistance. It creates a ‘W’ shape.

It is a bullish reversal pattern because it typically signifies the end of selling pressure and a shift toward an uptrend. If the market price breaks through the resistance level, it is likely to continue rising.
The head and shoulders pattern is formed of three highs – the central high is the greatest, flanked by two lower points. All three highs will fall to the same support level – known as the neckline – and while the first two will rebound, the final attempt will break out into a downtrend.

A rounded top or bottom are both reversals. A rounded top appears as an inverted ‘U’ shape, and indicates an imminent downtrend, while a rounded bottom appears as a ‘U’ and occurs before an uptrend.

The cup-and-handle pattern is similar to a rounded bottom, except it has a second, smaller, dip after it. The second smaller curve can resemble a flag pattern if the trend lines are parallel to each other.

The cup and handle acts as a confirmation of a rounded bottom, making it a reversal pattern too.