
S&P500 Forecast: SPX rebounds as big tech recovers & inflation is in focus
Article
Today 2:32 PM


Bollinger bands are another popular tool that can be used to predict market trends. In this lesson, we’ll take a closer look at how they work and how to use them.
Bollinger bands are a momentum indicator that are comprised of a simple moving average sandwiched between two lines plotting a positive and negative standard deviation – which measures how close prices are to the average.
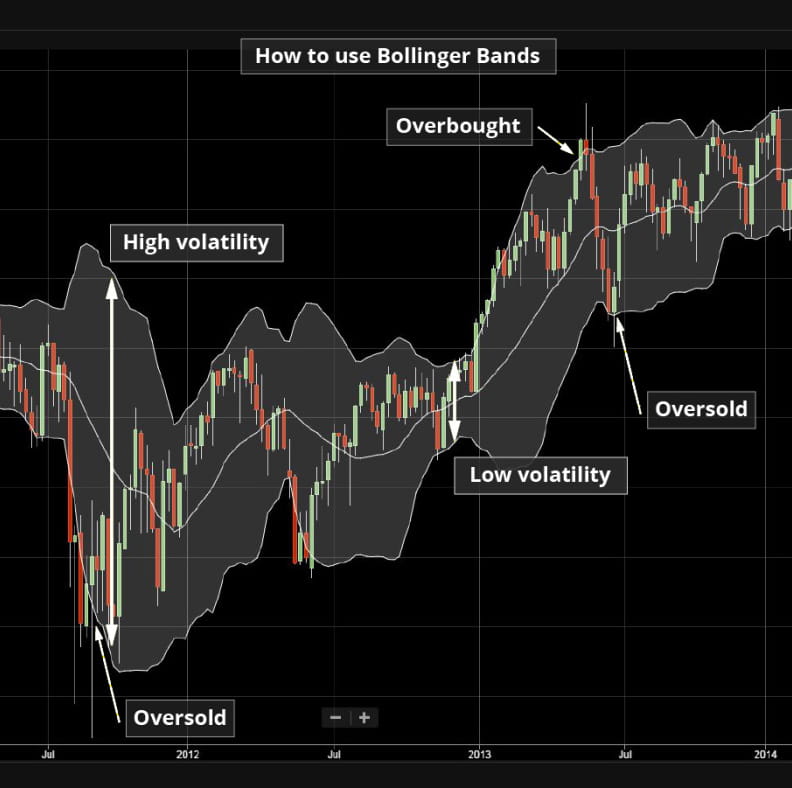
They forecast the potential high and low prices for a market relative to the moving average, helping traders visualise volatility and determine when a trend may continue or reverse. The bands widen during volatile periods and contract during non-volatile periods.
Bollinger bands can be used on multiple timeframes, ranging from minutes, hours, days and weeks. The common timeframes are daily for short-term traders and weekly for longer-term traders.
Bollinger bands consist of three bands:
During normal market conditions, the bands usually appear to move together, creating a synchronous pattern. But during volatility, this changes.
If the distance between the bands is tight, it indicates low volatility in the market. If the distance between the bands is wide, it shows high volatility in the market.
When price movements closely follow the middle band, traders consider the instrument to be trading within its average range.
As Bollinger bands are continually changing based on the real-time price movements, traders read the bands in a number of different ways.
Overbought signals
When price moves are close to the upper band, the current price of the instrument is considered high relative to recent prices. If they cross the upper band, traders consider the instrument to be overbought.
Oversold signals
When price moves are close to the lower band, the current price is considered low relative to recent prices. If they cross the lower band, traders consider the instrument to be oversold.