
S&P500 Forecast: SPX rebounds as big tech recovers & inflation is in focus
Article
Today 2:32 PM


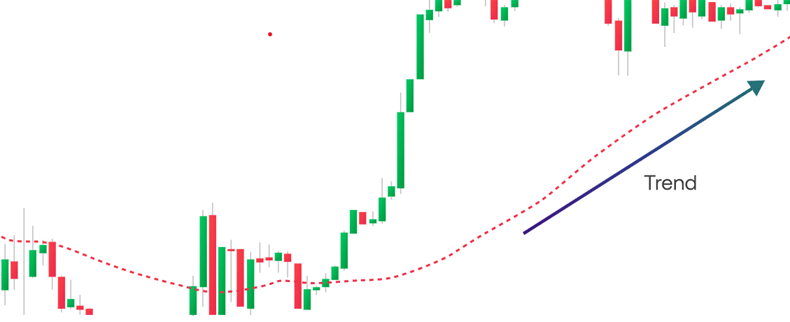
A moving average (MA) smooths price movements out into a single trend line. It’s one of the most popular indicators among technical analysts, so let’s look at how to use it.
Moving averages (MAs) are an indicator used to identify price trends. They smooth out the daily fluctuations on a chart that can cause markets to appear random or even noisy, making it easier to understand the main direction of movement.
The main purpose of a moving average is to determine the direction of a trend as early as possible by looking at past prices. As they’re based on historical data, all moving averages are lagging indicators and are not predictive.
There are many types of MAs and traders typically use more than one to determine market momentum.
The most popular are the simple moving average (SMA) and the exponential moving average (EMA).
A simple moving average (SMA) is calculated by finding the sum of a certain number of closing prices over a set period of time and then dividing it by the number in the series.
You can choose from a number of different time periods. The most popular are the 5-day, 10-day, 20-day, 50-day, 100-day and 200-day moving averages.
You can also change the timeframe of your MA, depending on whether you want to look at minutes, hours, days or weeks. For short-term traders, the most common timeframe is daily, and for longer term traders, it’s weekly.
To calculate a simple 5-day moving average of the closing price, the following formula can be used:
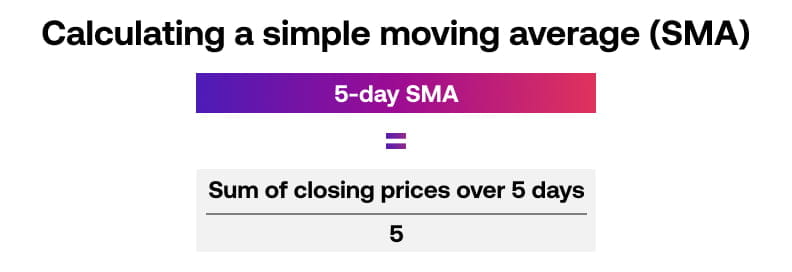
However, the indicator would do these calculations for you automatically and update the data depending on your parameters. So, for the daily average above, the series would update to include the current day's closing price.
In general, a market can be considered bullish when trading above its moving average and bearish when trading below the moving average.
However, they also generate some useful trading signals:
Buy signals
For a buy signal the moving average should be rising and pointing upwards. When the market closes above the MA, a buy signal can be implied. You’d exit the market when the market closes below the MA.
Sell signals
For a sell signal the moving average should be falling and pointing downwards. When the market closes below the moving average a sell signal can be considered. You’d exit the market when the market closes above the MA.
Moving average crossovers
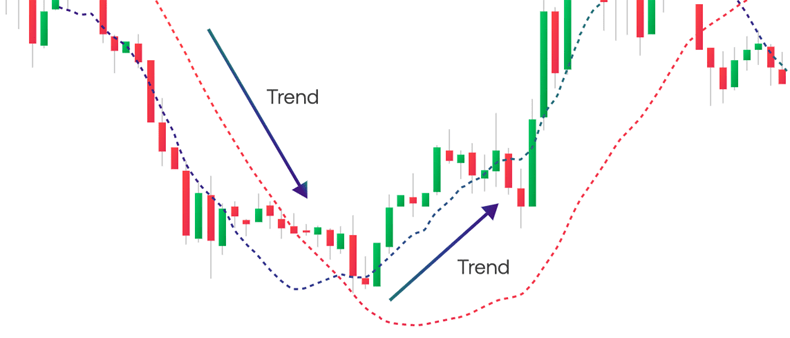
Another popular way of using the moving average indicator is a crossover technique. You’d apply two or more moving averages to your chart that have different data periods. Usually, a trader uses a slower moving average that has fewer periods and a longer MA that has more periods.
When the slower MA crosses over the faster MA, it’s a signal to enter or exit your trade.
For example, when an SMA with a short-term time period, say 15 days, crosses above an SMA with a long-term timeframe, say 50 days, it usually means that the market is in an uptrend.
When an SMA with a shorter time period crosses below an SMA with a longer time period, it usually means that the market is in a downtrend.
Traders can also use SMAs to detect areas of support when a trend changes direction. Generally, an SMA with a longer time period can identify a stronger level of support.
EMAs use simple moving averages as their base, but give more weight to the most recent prices, while a SMA gives all prices an equal weight.
Like simple moving averages, a rising EMA indicates that prices are rising, and if the current price is above the EMA line, it’s a buy signal. The opposite is true for a falling EMA.
EMAs generally react more quickly to price changes than other moving averages, which is why they’d be used over a SMA. However, while it gives a more accurate representation of recent prices, the EMA is also more prone to fluctuations.
The most common use of an EMA is as the base of other indicators, mainly the moving average convergence divergence (MACD), which we’ll look at now.
The MACD is a variant of the exponential moving average that helps traders forecast when to enter or exit a trade. It is a trend-following indicator, which can also be used to determine the underlying momentum behind a trend.
A MACD is comprised of three components:
The MACD measures the difference between the fast EMA and slow EMA, and provides buy and sell signals based on when either of the two lines cross each other.
It’s shown in a chart below the normal one – making it an oscillator. It also displays a histogram, which represents the difference between the MACD and its signal line, which is the 9-period moving average of the MACD itself.
The MACD can be used on multiple timeframes ranging across minutes, hours, days and weeks. The common timeframes are daily for short-term traders and weekly for longer-term traders. Some traders use the MACD on intraday timeframe charts to capture very short-term moves lasting from minutes to hours.
There are three main ways to use the MACD:
Crossovers
One of the most common techniques with the MACD is to wait for the MACD line to cross above the signal line for a buy signal (to enter a long position). Traders would expect a rising market with this signal.
Alternatively, when the MACD line crosses below the slow EMA then a trader could consider a sell signal to enter short and expect the market to fall.
Zero line cross
Some traders prefer to wait for the MACD to have crossed over its signal line and also cross above the zero line for a bullish signal. If the MACD has crossed from above to go below the zero line, then this would be considered a bearish signal.
Divergences
If the market is rising and forming higher highs but the MACD indicator has not followed suit, then this may indicate that a divergence is setting up.
Simply put, this means that both the market and the indicator are out of sync. When a divergence takes place, a possible reversal may be at hand.