


Heavyweights
U.S. bank sector leaders remain in focus at the start of another week with the S&P 500’s Financials’ segment starting the U.S. session as the second-largest negative contributor to the index. Although the sector eventually erased some weakness on Monday, the sight of 10-year Treasury yields turning lower again adds an edge to a growing chill for bank shares.
Yield relapse
The bond rally is partly tied to the Federal Reserve’s switch to an accommodative stance this year. In turn, the prospect of sustained policy easing is one that neither banks nor investors have relished given the corrosive effect on net interest income. With flat or even inverted yield curves showing signs of returning to normal in recent weeks as yields corrected higher, their relapse over the last few trading days has been particularly unwelcome. Given that inverted yield curves are seen as harbingers of recession as well as poor NII, it’s little surprise that S&P 500 Financials have yet to fully erase 2018’s fall of about 15%.
Repo redline
Lenders’ shares were also pressured last week as Wall Street’s main short-term loans market between banks, known as the ‘repo’ market, showed signs of stress, with rates soaring as high as 10%. The causes were almost certainly circumstantial—for instance lenders consolidating cash in advance of quarterly tax payments—whilst the Fed stepped in with huge buying operations to free the market up, helping short-term funding rates regain some stability by Monday. Yet the suspicion that the Fed’s effective rate went out of control possibly due to a hidden upset at a major player may linger, with consequences for U.S. bank stocks.
Guidance talked down
As well, the timing of yields’ reversal lower could scarcely be worse. After a decade of deleveraging and rationalisation brought the U.S. bank industry to its rudest health in decades, key revenue streams like investment banking and trading are sliding. The 12 biggest U.S. and European banks posted trading and advisory revenues in the first half of the year that were 11% lower than 2018, the slowest first half since 2006, according to industry monitor Coalition. A fortnight ago, speaking at an industry event, the CEOs of the top Wall Street lenders barely deviated from sober assessments of the third quarter ahead of their earnings next month.
Thoughts on Goldman Sachs Group Inc. Chart
For Goldman Sachs, the heaviest weight outperformer amongst giant U.S. banks this year, a 7% rise in 2019 is at stake. A lengthy ‘coil’ in a gently tapering wedge is the main pattern for the lender’s stock since it bottomed on 26th December 2018. The structure provides stability but also limits as the market navigates prices back up to the key failure high of $234 on 8th November 2018. Even before that level, investor wariness is perceptible from the reversal after a consolidation that lasted for several sessions towards the end of July, with a top at $222. Although GS’s 21-day exponential average is supportive, there is a difficult to shake sense of ‘playing for time’ in this chart that’s emblematic of shares in Goldman’s rivals too. At some point, overhead challenges will need to be faced again and repeated failures will point to the beginning of renewed weakness.
Goldman Sachs CFD – Daily
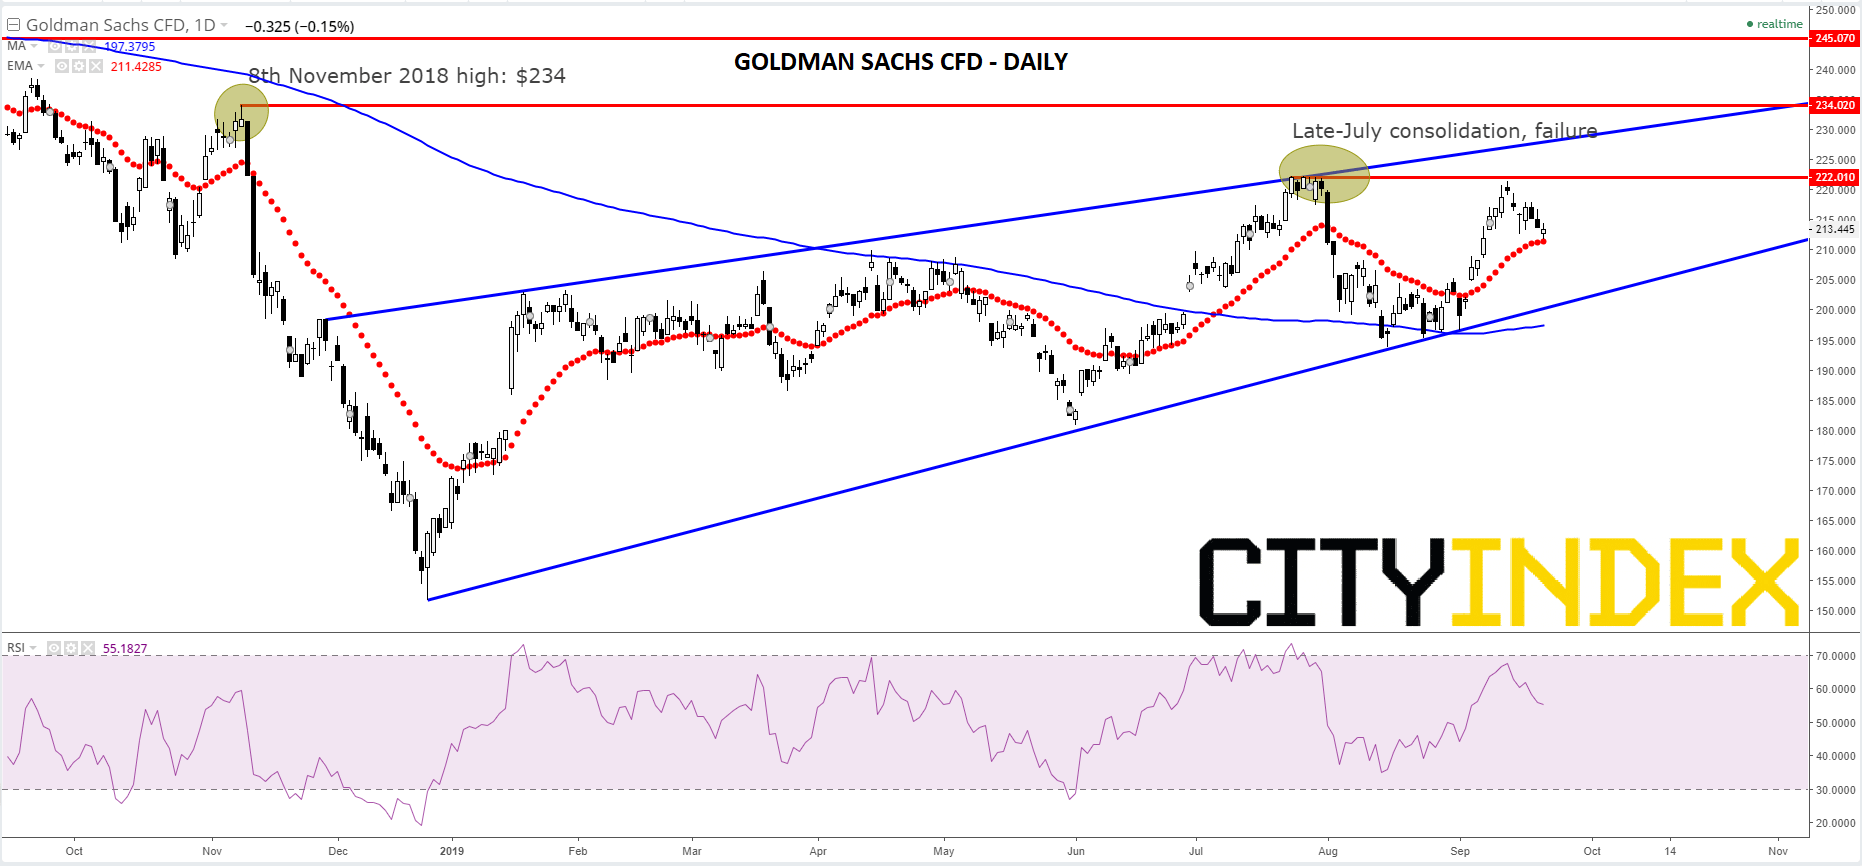
Source: City Index
Latest market news
Yesterday 01:32 PM
Yesterday 09:35 AM
Yesterday 07:23 AM
Yesterday 04:48 AM
Yesterday 12:17 AM
July 25, 2024 10:39 PM
Latest Bank Stocks articles

October 10, 2023 09:31 AM

October 6, 2023 02:28 PM

July 17, 2023 04:03 PM

July 11, 2023 02:28 PM