


- China’s A50 looks like it may have seen the lows
- Suppression of market forces from China’s ‘national team’ has limited downside
- A break of the 200-day moving average may bring more buyers from the sidelines
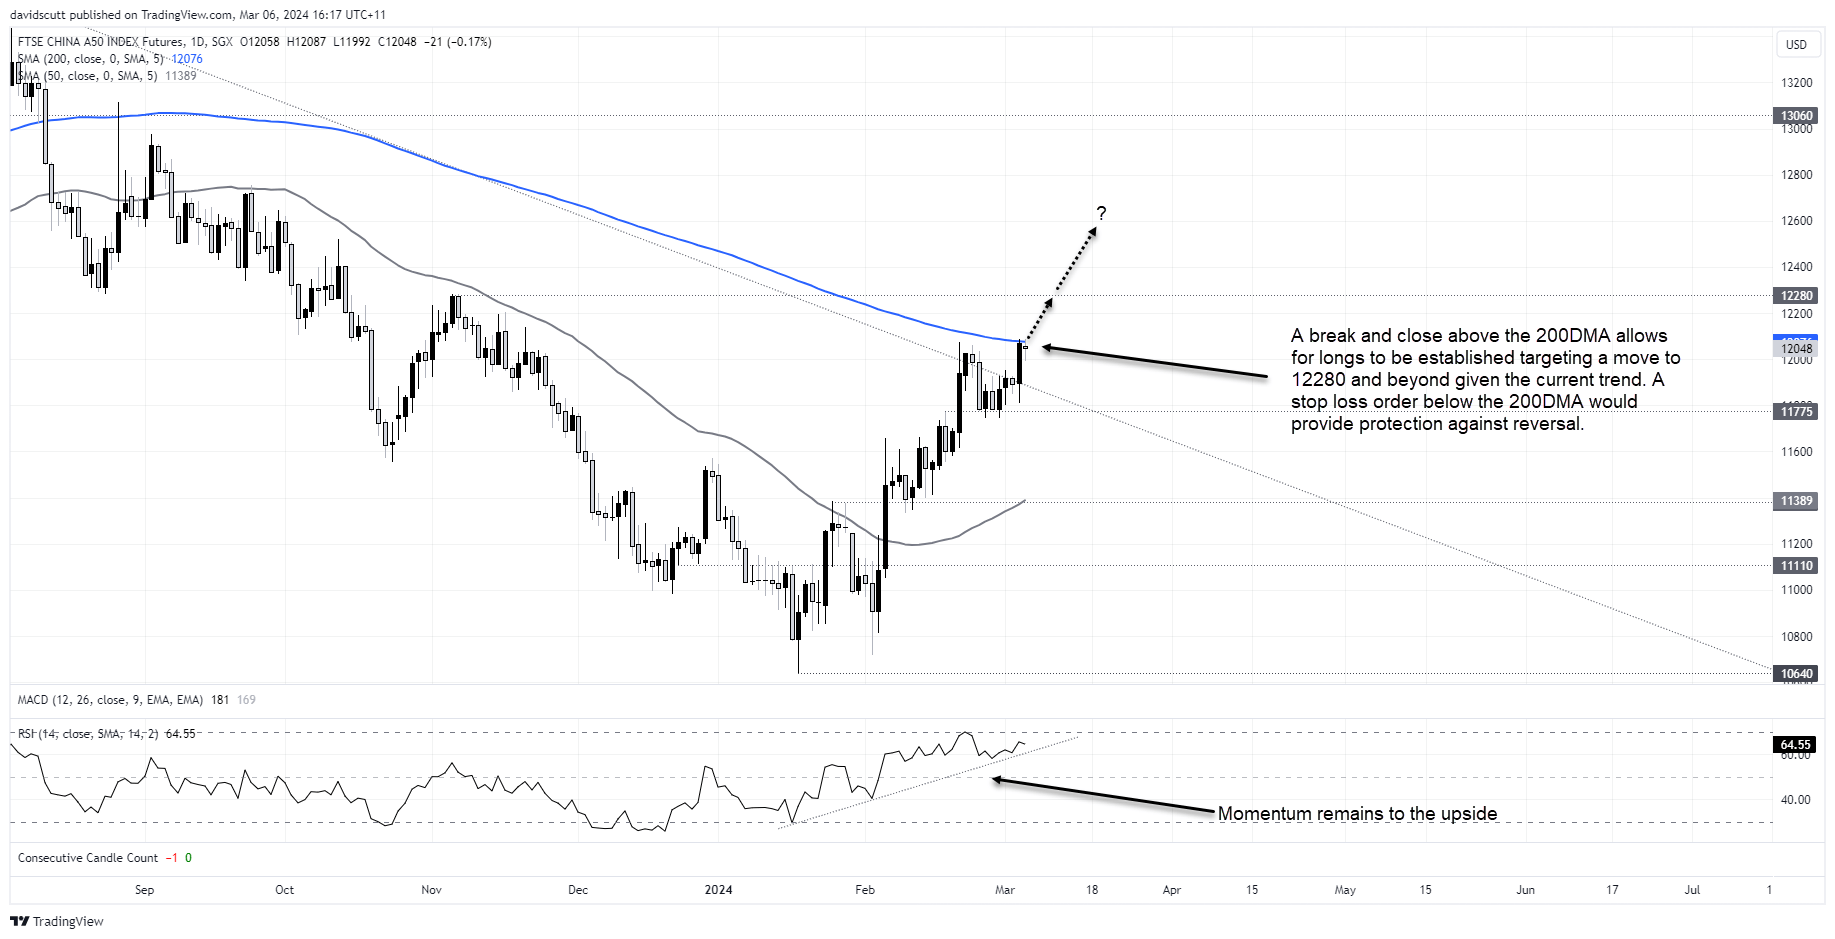
The bear market in Chinese equities may be coming a state-endorsed end with A50 futures breaking the downtrend dating back to early 2021 earlier this week. The 200-day simple moving average may be the next bearish indicator to give way, bolstering the view that the lows may have already been seen.
A manufactured rally but it’s working
The daily chart below only enhances the view the lows were set on January 18 with the price action becoming increasingly bullish moving into February. Pullbacks have become infrequent and increasingly shallow, assisted by China’s ‘National Team” rolling out a swathe of supportive measures including the direct purchase of ETFs from state-backed funds.
Yes, it’s the farthest thing from an organic rally that one can get but the limitation of markets forces is working. And as discussed in a post earlier this year, the longer it persists, the more likely investors may be willing to buy in rather than cut and run, improving the chances of a sustained uptrend.
That’s why the price action around the 200-day moving average looms as important.
China A50 testing 200DMA
After breaking downtrend resistance, to break and close above this closely watched moving average could usher in a new wave of upside for the underlying index. Should Wednesday’s candle manage to close above the 200DMA, it provides the opportunity to establish longs with a stop-loss below targeting a move to the next layer of horizontal resistance located at 12280. Beyond, there’s little visible major resistance evident until you reach 13060.
A failure to break the 200DMA does provide an opportunity to do the opposite trade targeting a decline towards 11775, although that screens as the lower probability play given momentum remains to the topside with the national team still active.
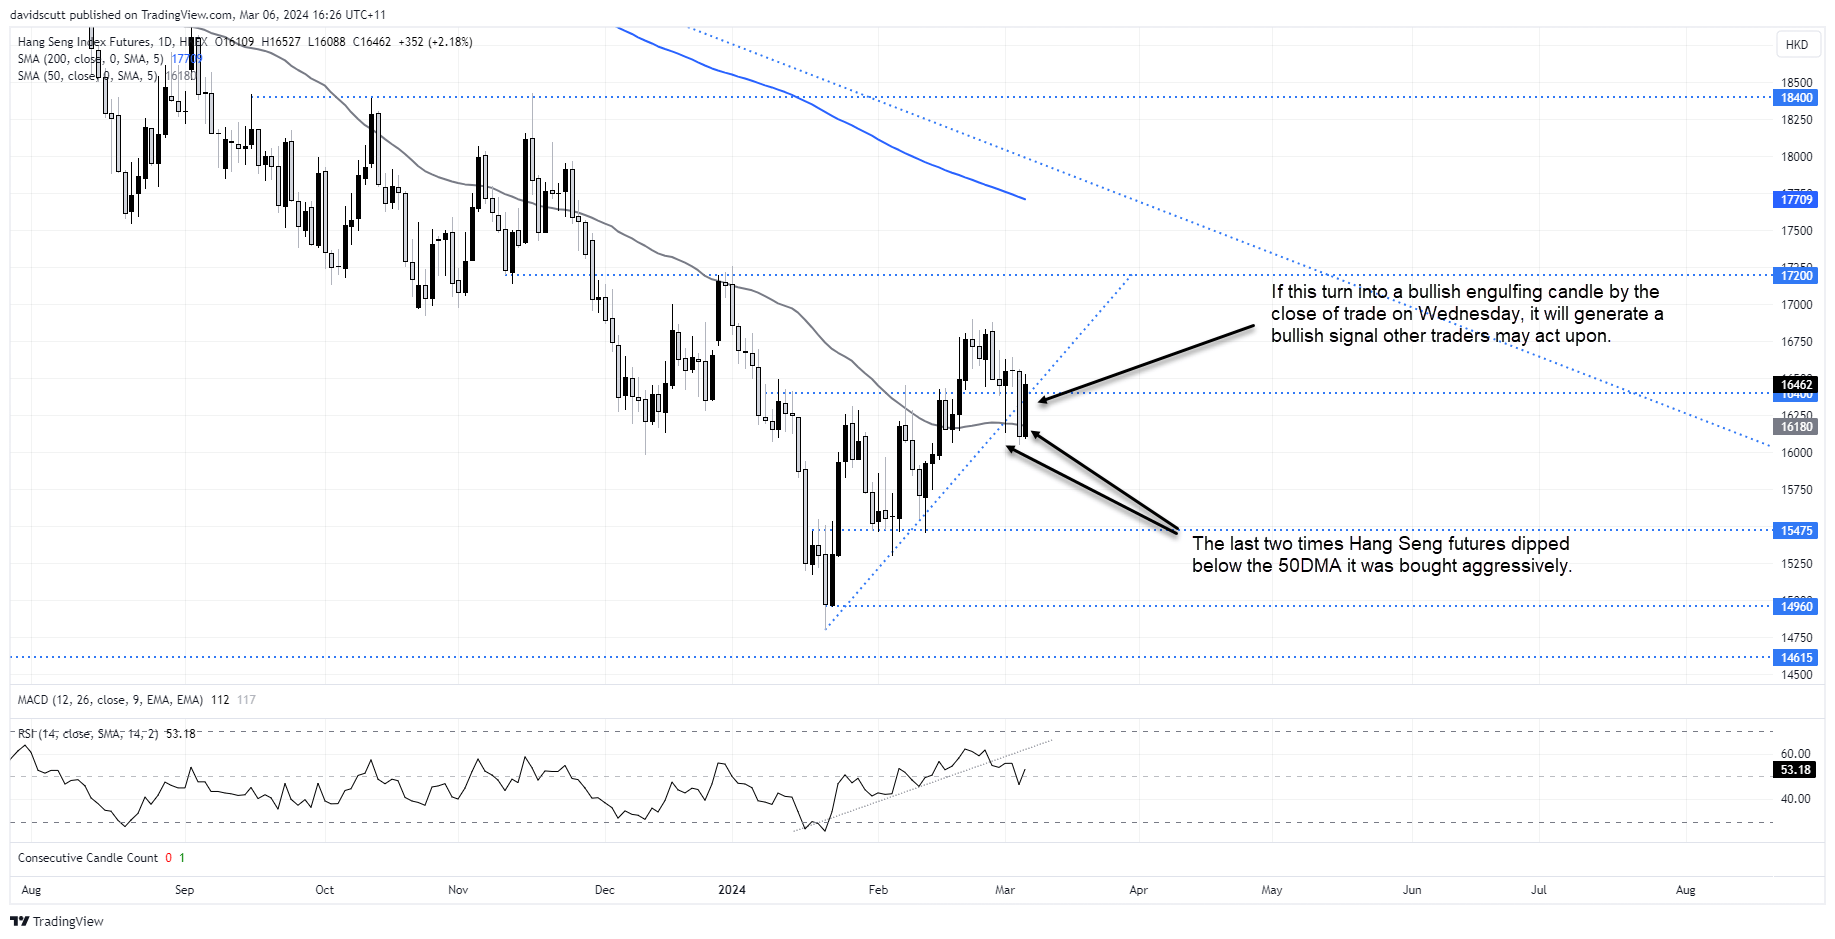
Hang Seng futures find bids at 50DMA
While the technical picture is not as robust for Hang Seng futures which remain a fair distance away from breaking its longer-term downtrend, it’s obvious from the price action around the 50DMA that this level is important for its near-term performance.
It found support at the level late last week and again today after Tuesday’s ugly plunge, not only sending it back through the minor uptrend dating back to January’s lows but also horizontal resistance at 16400. Like the A50, I want to see how it closes on Wednesday before making a trade. But should it be able to rally above where futures opened Tuesday, the potential bullish engulfing candle would send a strong signal that upside may be easier won from these levels.
If that were to eventuate, it could allow for longs positions to be set looking initially for a test of 16800 – where it encountered sellers in February. Beyond, the next upside target would be 17200 before the 200DMA and long-run downtrend come into play. As for protection, I’d only be willing to place a stop-loss below 16400 given the potential risk-return. You could look below the lows hit earlier this week but only if your trade envisages a push beyond 17200. Size accordingly.
-- Written by David Scutt
Follow David on Twitter @scutty
How to trade with City Index
You can trade with City Index by following these four easy steps:
-
Open an account, or log in if you’re already a customer
• Open an account in the UK
• Open an account in Australia
• Open an account in Singapore
- Search for the market you want to trade in our award-winning platform
- Choose your position and size, and your stop and limit levels
- Place the trade
Latest market news
April 25, 2024 03:09 PM
April 25, 2024 03:00 PM
April 25, 2024 01:12 PM
Latest Equities articles

April 12, 2024 02:28 AM

April 7, 2024 08:46 PM

March 31, 2024 11:22 AM
