


May 31, 2022 7:59 PM
China released its official Manufacturing and Non-Manufacturing PMI data for May. The NBS Manufacturing PMI was 49.6 vs an expectation of 48.9 and an April reading of 47.4. The NBS Non-Manufacturing PMI for May was 47.8 vs an expectation of 45 and an April reading of only 41.9! Although both prints are under the expansion/contraction level of 50, both are moving in the right direction and suggest that a bottom may be in as China’s economy begins to reopen. Look for the Caixin Manufacturing and Non-Manufacturing PMIs to confirm later this week.
In addition, with workers returning to work in low-risk areas and with high-risk areas, such as malls and gyms, looking to reopening at 75% capacity, data should begin to show signs of life once again. This is particularly true in Shanghai, which has been on lockdown for nearly 2 months. To help the economy restart, the government has announced a number of policies to help the recovery. According to documents obtained by Reuters, China’s cabinet announced a package of 33 measures covering fiscal, financial, investment, and industrial policies. Some of these measures include increasing quotas for car ownership, halving the purchase tax for small-engine cars, supporting domestic firms to list in Hong Kong, and reduce borrowing costs for infrastructure and major projects. China will also provide tax credit rebates to more industries hard hit by the coronavirus and allow them to defer social security payments.
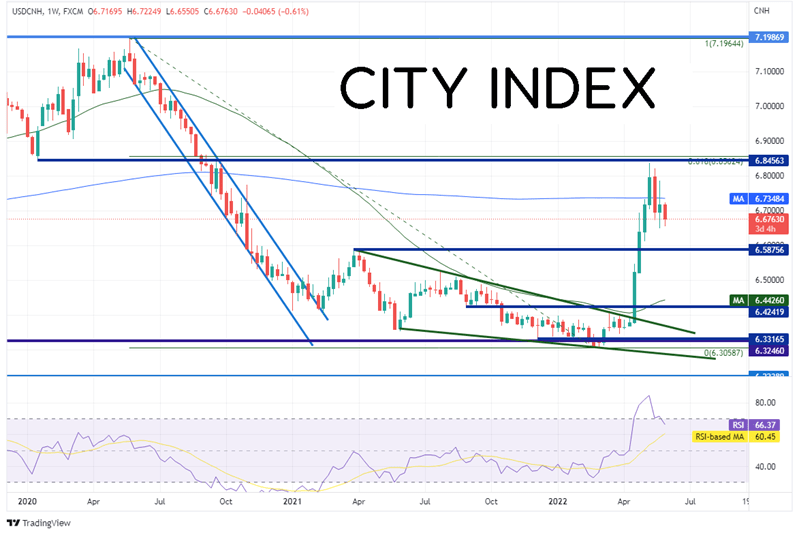
On a weekly timeframe, USD/CNH had moved in a downward sloping channel from the high in May 2020 to low during the week of February 18th, 2021. As the pair moved sideways out of the channel, if formed a descending wedge between 6.5876 and 6.3059 from March 2021 to April 2022. USD/CNH then broke aggressively higher as China moved into restrictions and lockdowns in Shanghai. The pair broke above the wedge near 6.3958 and over the course of only 4 weeks, moved aggressively to just under the 61.8% Fibonacci retracement level from the highs of May 2020 to the lows of February 2022, near 6.8375. Horizontal resistance dating to January 2020 also crosses just above the highs.
Source: Tradingview, Stone X
Trade USD/CNH now: Login or Open a new account!
• Open an account in the UK
• Open an account in Australia
• Open an account in Singapore
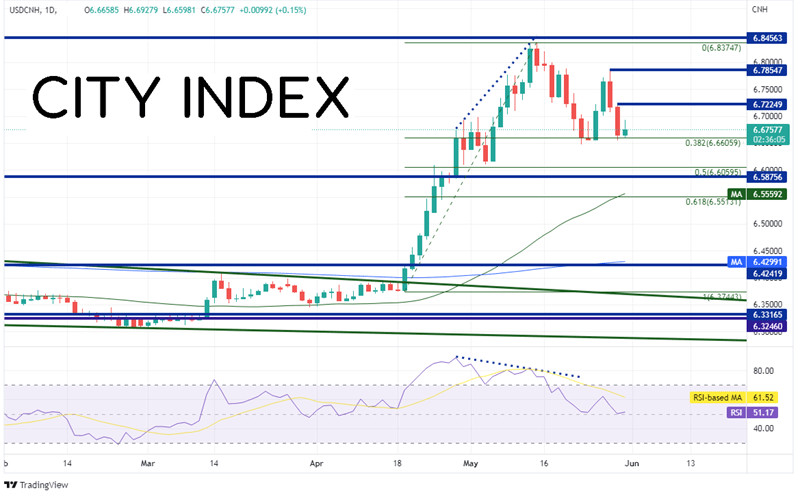
On a daily timeframe, USD/CNH has since pulled back from the May 13th highs and has found support at the 38.2% Fibonacci retracement level from the lows of April 19th (the day of the breakout of the wedge) to the highs on May 13th, near 6.6606. Notice how the RSI was diverging from price in overbought territory near the highs, an indication that price may have been ready to pull back. If price continues to move lower, the next support level is at the 50% retracement level from the same timeframe near 6.6506, then horizontal support dating back to the top of the wedge at 6.5876. Below there, price can fall to the 50 Day Moving Average at 6.5560. If the 38.2% Fibonacci retracement level holds, first resistance is at yesterday’s high of 6.7225, then May 27th high at 6.7855. If price breaks above, the next resistance level is the highs from May 13th at 6.8375.
Source: Tradingview, Stone X
China is back and looking to move forward. With some help from the government, the trough in the PMI data may be behind us. Watch to see if economic activity and picks up over the next month. If so, USD/CNH may be ready to move lower. However, if stimulus continues and growth doesn’t pick up, USD/CNH many continue to move higher.
Learn more about forex trading opportunities.
Latest market news
Yesterday 03:00 PM
Yesterday 01:12 PM
Yesterday 11:14 AM
Latest Trade Ideas articles
Yesterday 03:00 PM
Yesterday 11:14 AM
April 24, 2024 11:00 AM