


March 24, 2022 7:15 PM
Gamestop (GME) chairman Ryan Cohen bought an additional 100,000 shares of the company recently to bring his total holdings to about 12%. As a result, the share price of GME has jumped nearly 50% so far this week, from an opening print of 90.00 to this week’s high, thus far, of 150.93! As has been the case, meme stock AMC followed GME higher. Recently, to the surprise of many, AMC Entertainment bought 22% of Hycroft Mining, a gold mine company. (And if you are a fan, AMC announced a deal with WWE that Wrestlemania will be live in AMC theaters on April 2nd and 3rd!). AMC is currently up nearly 30% for the week.
What is GameStop and why did it trigger a short squeeze in 2021?
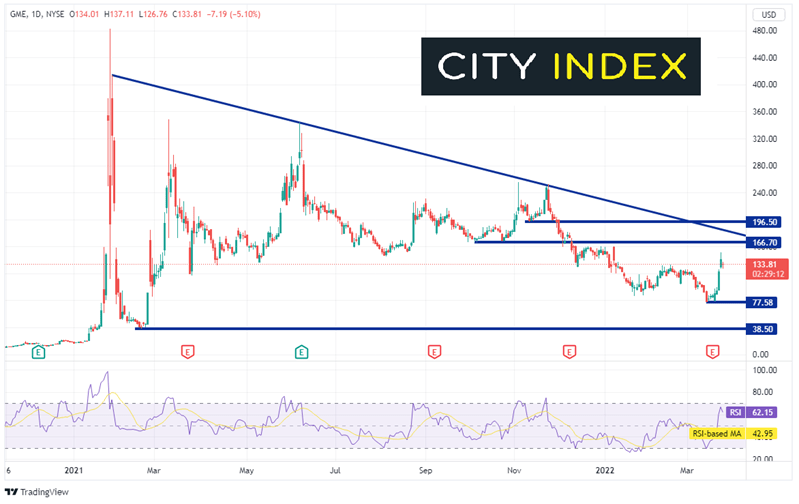
On a daily timeframe, GME has been moving lower since making all-time highs in January 2021 after traders at Wallstreetbets on Reddit squeezed the stock to 483.00. Price retraced nearly 100% of the move higher, making a low of 38.50 by the week of February 19th, 2021! Since then, the stock bounced to 344.46 and has been trading in a descending triangle, making lower highs along the way. Last week, price reached its lowest level in a year at 77.58 before bouncing aggressively this week.
Source: Tradingview, Stone X
Trade GME now: Login or Open a new account!
• Open an account in the UK
• Open an account in Australia
• Open an account in Singapore
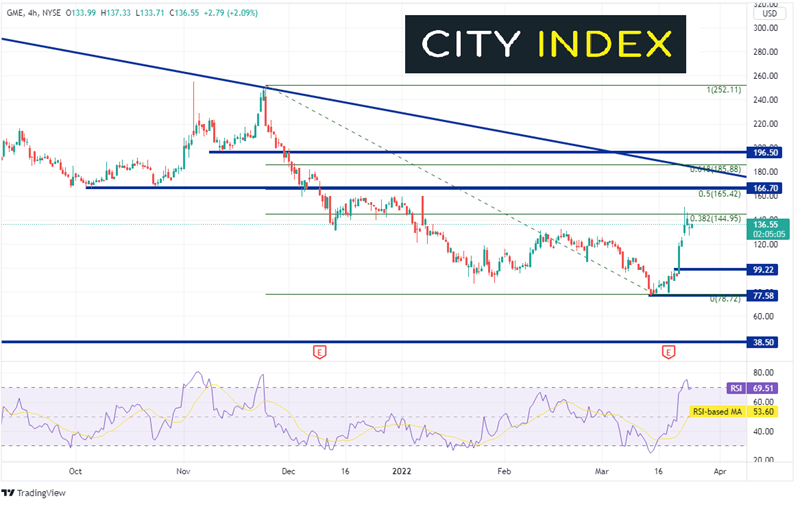
On a 240-minute chart price has retraced to the 38.2% Fibonacci level from the highs of November 23rd, 2021 to the low of March 14th, near 144.95. Horizontal resistance and the 50% retracement from the same timeframe are the next resistance level between 165.42 and 166.70. The 61.8% Fibonacci retracement level and the downward trendline of the long-term triangle sits above there near 185.55. If GME moves lower, support at the gap from March 22nd is at 125.60. Below there, price can fall back to near-term horizontal support at 99.22, then the March 14th low at 77.58.
Source: Tradingview, Stone X
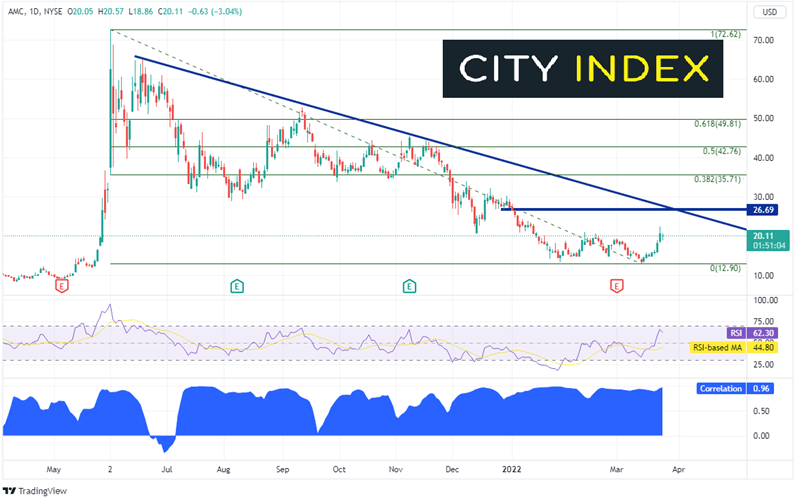
The daily chart of AMC looks very similar to that of GME as price made a move from 13.61 to 72.62 in a matter of weeks. However, the run-up in price didn’t occur until May. In addition, after the move higher, AMC didn’t retrace the entire move as did GME. AMC immediately began making lower lows and lower highs and reached its lowest point since the run-up on March 14th at 12.90. However, with the move higher in GME, AMC moved right along with it. Notice the correlation coefficient at the bottom of the chart is +0.96. A correlation coefficient of +1.00 is a perfect correlation, meaning that the 2 stock prices move in the same direction 100% of the time. +0.96 is pretty close.
Source: Tradingview, Stone X
Trade AMC now: Login or Open a new account!
• Open an account in the UK
• Open an account in Australia
• Open an account in Singapore
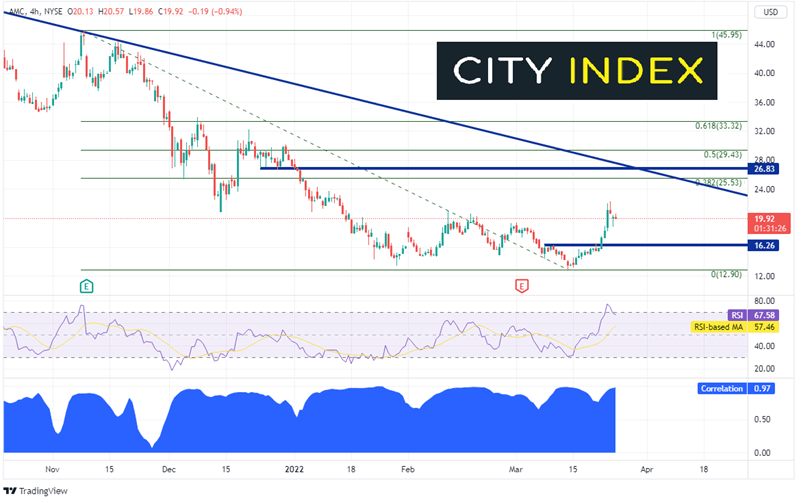
On a 240-minute chart, the correlation coefficient is just as strong as on the daily timeframe. First resistance is at the 38.2% Fibonacci retracement from the highs of November 8th, 2021 to the low of March 14th at 25.53. Just above there is confluence of horizontal resistance and the downward sloping trendline of the long-term triangle near 26.83, then the 50% retracement from the recently mentioned timeframe at 29.43. Horizontal support sits below at 16.36, then the March 14th lows at 12.90.
Source: Tradingview, Stone X
Meme stocks GME and AMC have been on the move once again. In the grand scheme of things, the 2 stock price moves have been relatively small, as they haven’t even retraced to the 38.2% Fibonacci level from their all-time highs. However, the move was enough for them to get noticed!
Latest market news
Yesterday 03:00 PM
Yesterday 01:12 PM
Yesterday 11:14 AM
Yesterday 08:28 AM
April 24, 2024 03:30 PM
Latest Trade Ideas articles
Yesterday 03:00 PM
Yesterday 11:14 AM
April 24, 2024 11:00 AM
April 24, 2024 08:15 AM