S&P 500 – Consolidation in progress before new potential upleg
 (Click to enlarge charts)
Key Levels (1 to 3 weeks)
Intermediate support: 2425/20
Pivot (key support): 2403
Resistances: 2457 & 2467/76
Next support: 2354
Medium-term (1 to 3 weeks) Outlook
Last week, the S&P 500 Index (proxy for the S&P 500 futures) had managed to push higher at the start and printed a new all-time high level of 2454 on Tues, 20 June in the U.S. session as expected. Click here for a recap on our previous weekly technical outlook.
Thereafter, the Index started to pull-back by 0.9% and almost erased off its initial gains. Current key elements as follow:
- The daily RSI oscillator has managed to hold at its corresponding first support at the 55% which suggests that medium-term upside momentum of price action remains intact.
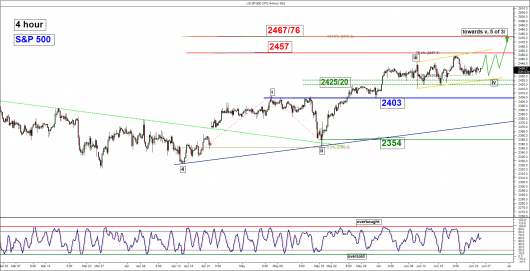
- In the shorter-term, the Index continues to evolve within an “ascending range” configuration (depicted in light brown) in place since 09 June 2017 high (see 4 hour chart).
- The upper boundary of aforementioned “ascending range” configuration stands at 2456 which also confluences with the 0.764 Fibonacci projection of the recent rally from 15 June 2017 minor swing low to the 2454 current all-time high projected to 22 June 2017 low of 2430 (see 4 hour chart).
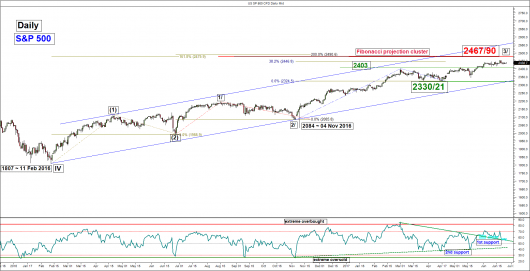
- The next significant medium-term resistance of the Index stands at the 2467/76 zone which is defined by the upper boundary of a short-term bullish ascending in place since 18 May 2017 low and a Fibonacci projection cluster (see daily & 4 hour charts).
- The intermediate support rests at the 2425/20 zone which is defined by the lower boundary of the aforementioned short-term “ascending range” configuration (see 4 hour chart).
- The significant medium-term support remains at 2403 which is defined by the former range top area of 08 May/16 May 2017 (see daily chart).
- The Technology sector ETF (XLK) has started to increase its outperformance against the S&P 500 as it recouped its losses from its earlier rout on 09 June 2017. Another high beta growth sector, Biotechnology (XBI) has roared back to life after it underperformed the S&P 500 most of time since the start of the year and now has overtaken the leadership position from Technology. The Health Care sector ETF (XLV) has also benefited in the recent resurgence of biotechnology stocks reinforced by a new stance adopted by U.S. President Trump’s administration on the pricing of prescription drugs where his administration is working on an executive order about drug prices that will reportedly ease regulations. From a sector rotation analysis perspective, the recent outperformance seen in the growth sectors (Technology and Biotechnology) do not indicate a potential medium-term top in the S&P 500 (refer to the 3rd chart).
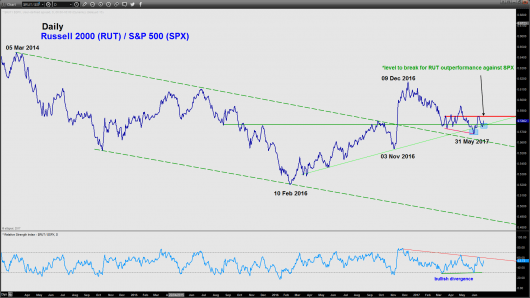
- Also, the relative strength chart analysis of Russell 2000 versus S&P 500 has indicated that the recent underperformance of Russell 2000 in place since 09 December 2016 has started to ease. These observations suggest that “some confidence” has returned to the higher risk small-cap stocks that derived most of their revenue from the U.S. domestic economy despite the recent plunge in oil prices, flattening Treasury yield curve and implementation risk of Trumponomics (refer to the last chart).
Therefore, we are maintaining our bullish bias on the Index for another potential push up to print a marginal new all-time high of 2457 before another round of consolidation sets in. A clear break above 2457 is required to reinforce the start of a potential bullish impulsive up move to target the next resistance at 2467/76.
However, a break below the 2403 medium-term pivotal support is likely to invalidate the preferred bullish scenario to open up scope for a corrective decline to retest the next support at 2354 in the first step.
Nikkei 225 – Due for another potential bullish breakout
 (Click to enlarge charts)
Key Levels (1 to 3 weeks)
Intermediate support: 20000
Pivot (key support): 19740
Resistances: 20500/660 & 20950/21100
Next supports: 19280 & 18860/640
Medium-term (1 to 3 weeks) Outlook
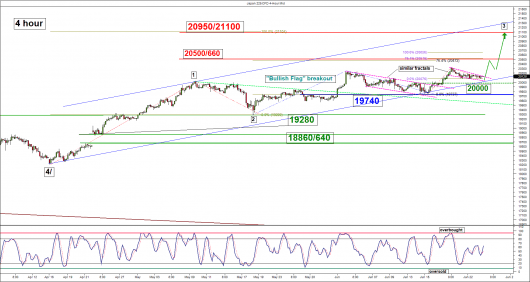
Last week, the Japan 225 Index (proxy for the Nikkei 225 futures) pushed higher at the start of the week and printed a new marginal high of 20326 on Tues, 20 June. Thereafter, it staged a pull-back of 1.2% and traded sideways.
Current key elements as follow;
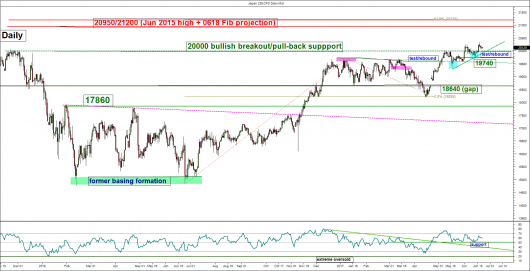
- The on-going pull-back has stalled right above an intermediate support of 20000 which is defined by former medium-term swing high area of November/December 2015 and the lower boundary of a short-term bullish ascending channel in place since 17 April 2017 low (see daily & 4 hour charts).
- The current pull-back seen from the 20326 high of 20 June 2017 is similar in terms of fractals geometry with the former “ bullish flag” pull-back seen from 02 June/15 June 2017 before the bullish breakout (see 4 hour chart).
- The daily RSI oscillator has continued to hover above its corresponding support at the 50% level which suggests that medium-term upside momentum of price action remains intact.
- The key medium-term support remains at 19740 which is defined by the 14 June 2017 swing low area and a Fibonacci cluster (see 4 hour chart).
- The next significant medium-term resistances stands at 20500/660 follow by 20950/21100 which is defined by major swing high area of 24 June/11 August 2015, the upper boundary of a short-term ascending channel in place since 17 April 2017 and the 1.00 Fibonacci projection of the up move from 17 April 2017 low to 10 May 2017 minor swing high of 20025 projected from 18 May 2017 minor swing low of 19283) (see 4 hour chart).
Therefore, we maintain our bullish bias as long as the 19740 medium-term pivotal support holds for a potential upleg to target the next resistances at 20500/660 follow by 20950/21100 next.
However, a clear break below (daily close) 19740 is likely to invalidate the preferred bullish bias to revive the bears for a corrective decline towards the next supports at 19280 and 18660/640 (gap that was formed after the outcome of the 1st round of the French presidential election).
Hang Seng – Maintain bullish bias above 25485/25000 support
 (Click to enlarge charts)
Key Levels (1 to 3 weeks)
Intermediate support: 25485
Pivot (key support): 25000
Resistances: 26335/400 & 26960
Next support: 23700/400
Medium-term (1 to 3 weeks) Outlook
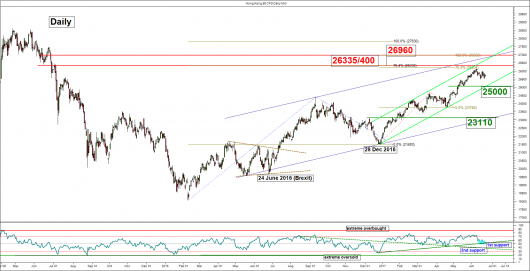
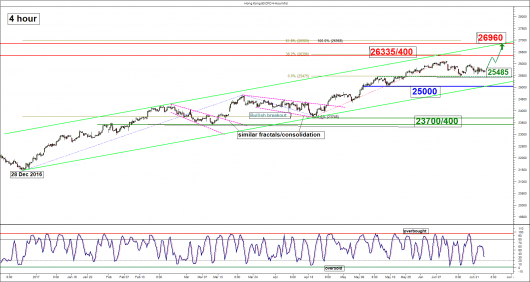
The Hong Kong 50 Index (proxy for Hang Seng Index futures) had continued to consolidate within a tight range of 1.7% after its prior marginal high of 26114 printed on 09 June 2017. Click here for a recap on our previous weekly technical outlook.
No major changes in its technical elements. We maintain the bullish bias above the 25000 medium-term pivotal support for another potential upleg to target the next resistances at 26335/400 follow by 26960 next.
On the other hand, failure to hold above 25000 may jeopardise the preferred bullish bias to open up scope for a corrective decline towards the next support at 23700/400 (former congestion swing lows area of 09 March/19 April 2017 & the 50% Fibonacci retracement of the on-going up move since 28 December 2016 low).
ASX 200 – Potential bearish pressures reignite
 (Click to enlarge charts)
Key Levels (1 to 3 weeks)
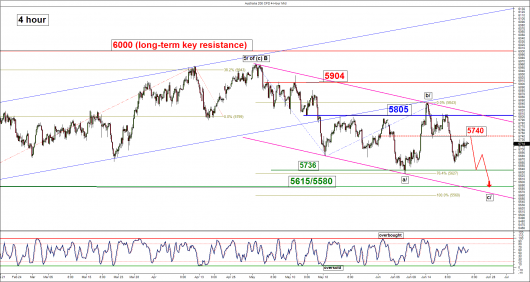
Intermediate resistance: 5740
Pivot (key resistance): 5805
Supports: 5736 & 5615/5580
Next resistances: 5904 & 6000
Medium-term (1 to 3 weeks) Outlook
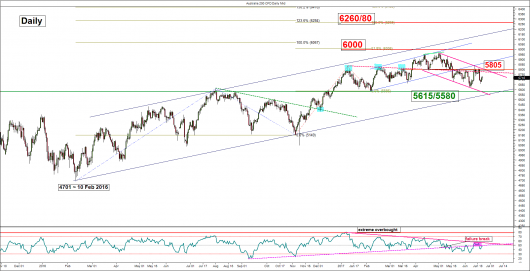
Last week, the Australia 200 Index (proxy for the ASX 200 futures) had staged a bearish breakdown below the 5733 medium-term neutrality zone’s lower limit on Wed, 21 June which flipped the bias back to the bears.
Current key element as follow:
- The Index has continued to evolve within a medium-term descending channel in place since 01 May 2017 high with its upper boundary acting as a resistance at around 5805.
- The daily RSI oscillator has reintegrated back below its pull-back resistance which has indicated a failure bullish breakout seen on 18 June 2017.
- The significant medium-term support rests at the 5615/5580 zone which is defined by the lower boundary of a long-term ascending channel in place since 10 February 2016 low, the 06 February 2017 swing low area and also close to the lower boundary of the aforementioned descending channel (see daily chart).
Therefore, we have flipped back to our initial bearish bias and as long as the 5805 medium-term pivotal resistance is not surpassed, the Index is likely to resume its potential bearish impulsive downleg to retest 5636( 08 June 2017 minor swing low area) before targeting the next support at 5615/5580 zone.
However, a clearance above 5805 may invalidate the preferred bearish scenario to see a squeeze up towards the next resistance at 5904 (swing high area of 04 May/11 May 2017).
DAX – Consolidation between 12960 and 12650/490
 (Click to enlarge charts)
Key Levels (1 to 3 weeks)
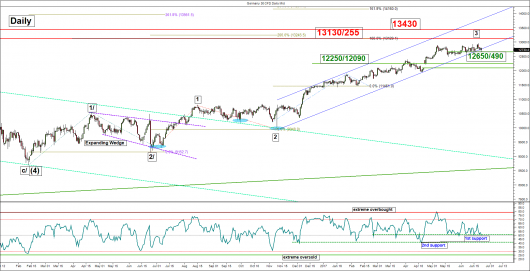
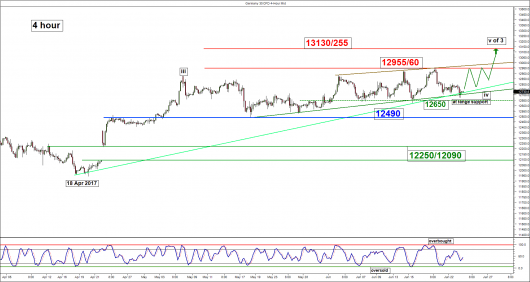
Intermediate support: 12650
Pivot (key support): 12490
Resistances: 12955/60 & 13130/255
Next support: 12250/12090
Medium-term (1 to 3 weeks) Outlook
Last week, the Germany 30 Index (proxy for the DAX futures) had rallied and printed a new all-time high of 12955 on 20 June 2017. Thereafter, it staged a 2% decline and erased all its initial gains.
No major changes in its technical elements. The Index is now back at its 12650 minor range support in place since 18 May 2017 low where a potential push up may occur towards the range top/resistance at 12955/60. Only a break above 12960 is likely to open up scope for an impulsive upleg to target the next resistance at 13130/255
On the other hand, failure to hold above the adjusted 12490 medium-term pivotal support is likely to jeopardise the bullish tone for corrective decline towards the 12250/12090 gap support seen after the outcome of the 1st round of the French presidential election.
Charts are from City Index Advantage TraderPro & eSignal
Disclaimer
The material provided herein is general in nature and does not take into account your objectives, financial situation or needs. While every care has been taken in preparing this material, we do not provide any representation or warranty (express or implied) with respect to its completeness or accuracy. This is not an invitation or an offer to invest nor is it a recommendation to buy or sell investments. City Index recommends you to seek independent financial and legal advice before making any financial investment decision. Trading CFDs and FX on margin carries a higher level of risk, and may not be suitable for all investors. The possibility exists that you could lose more than your initial investment further CFD investors do not own or have any rights to the underlying assets. It is important you consider our Financial Services Guide and Product Disclosure Statement (PDS) available at www.cityindex.com.au, before deciding to acquire or hold our products. As a part of our market risk management, we may take the opposite side of your trade. GAIN Capital Australia Pty Ltd (ACN 141 774 727, AFSL 345646) is the CFD issuer and our products are traded off exchange.


